Houma vs Yugoslavian Master's Degree
COMPARE
Houma
Yugoslavian
Master's Degree
Master's Degree Comparison
Houma
Yugoslavians
7.9%
MASTER'S DEGREE
0.0/ 100
METRIC RATING
347th/ 347
METRIC RANK
14.4%
MASTER'S DEGREE
24.3/ 100
METRIC RATING
203rd/ 347
METRIC RANK
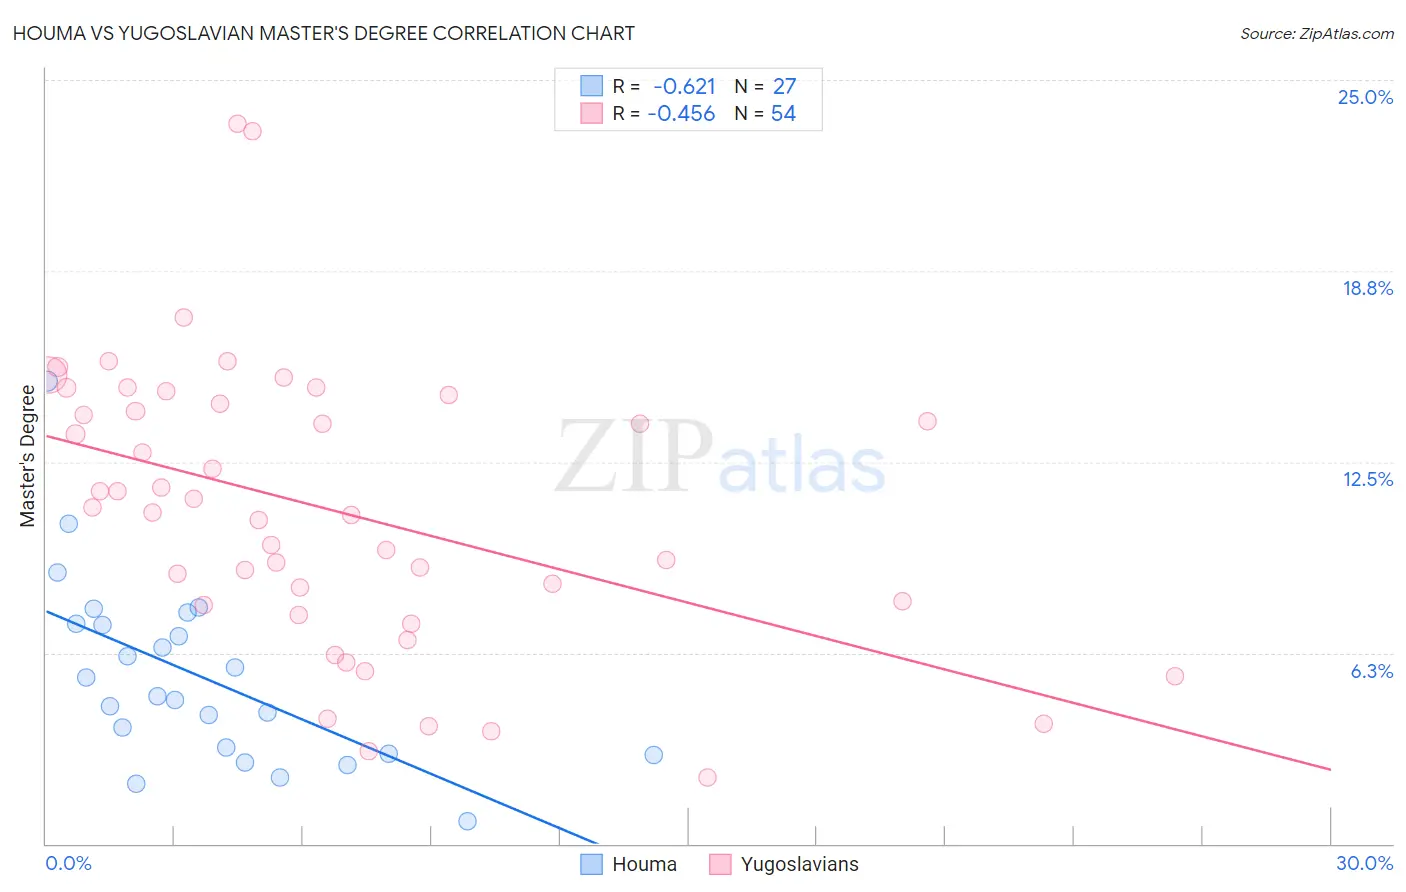
Houma vs Yugoslavian Master's Degree Correlation Chart
The statistical analysis conducted on geographies consisting of 36,787,451 people shows a significant negative correlation between the proportion of Houma and percentage of population with at least master's degree education in the United States with a correlation coefficient (R) of -0.621 and weighted average of 7.9%. Similarly, the statistical analysis conducted on geographies consisting of 285,661,106 people shows a moderate negative correlation between the proportion of Yugoslavians and percentage of population with at least master's degree education in the United States with a correlation coefficient (R) of -0.456 and weighted average of 14.4%, a difference of 81.7%.
Master's Degree Correlation Summary
| Measurement | Houma | Yugoslavian |
| Minimum | 0.74% | 2.2% |
| Maximum | 15.1% | 23.6% |
| Range | 14.4% | 21.4% |
| Mean | 5.5% | 10.9% |
| Median | 4.8% | 10.9% |
| Interquartile 25% (IQ1) | 3.0% | 7.8% |
| Interquartile 75% (IQ3) | 7.2% | 14.4% |
| Interquartile Range (IQR) | 4.2% | 6.6% |
| Standard Deviation (Sample) | 3.0% | 4.7% |
| Standard Deviation (Population) | 3.0% | 4.6% |
Similar Demographics by Master's Degree
Demographics Similar to Houma by Master's Degree
In terms of master's degree, the demographic groups most similar to Houma are Yup'ik (8.5%, a difference of 8.0%), Yuman (9.2%, a difference of 16.7%), Pima (9.2%, a difference of 16.9%), Lumbee (9.3%, a difference of 17.1%), and Immigrants from Mexico (9.3%, a difference of 17.6%).
| Demographics | Rating | Rank | Master's Degree |
| Menominee | 0.0 /100 | #333 | Tragic 10.2% |
| Arapaho | 0.0 /100 | #334 | Tragic 10.0% |
| Immigrants | Central America | 0.0 /100 | #335 | Tragic 10.0% |
| Natives/Alaskans | 0.0 /100 | #336 | Tragic 9.9% |
| Mexicans | 0.0 /100 | #337 | Tragic 9.7% |
| Tohono O'odham | 0.0 /100 | #338 | Tragic 9.7% |
| Spanish American Indians | 0.0 /100 | #339 | Tragic 9.6% |
| Yakama | 0.0 /100 | #340 | Tragic 9.5% |
| Navajo | 0.0 /100 | #341 | Tragic 9.4% |
| Immigrants | Mexico | 0.0 /100 | #342 | Tragic 9.3% |
| Lumbee | 0.0 /100 | #343 | Tragic 9.3% |
| Pima | 0.0 /100 | #344 | Tragic 9.2% |
| Yuman | 0.0 /100 | #345 | Tragic 9.2% |
| Yup'ik | 0.0 /100 | #346 | Tragic 8.5% |
| Houma | 0.0 /100 | #347 | Tragic 7.9% |
Demographics Similar to Yugoslavians by Master's Degree
In terms of master's degree, the demographic groups most similar to Yugoslavians are Immigrants from Western Africa (14.4%, a difference of 0.11%), French (14.4%, a difference of 0.11%), Panamanian (14.4%, a difference of 0.13%), Scotch-Irish (14.4%, a difference of 0.13%), and Trinidadian and Tobagonian (14.4%, a difference of 0.15%).
| Demographics | Rating | Rank | Master's Degree |
| Czechoslovakians | 29.9 /100 | #196 | Fair 14.5% |
| Belgians | 28.0 /100 | #197 | Fair 14.5% |
| West Indians | 27.4 /100 | #198 | Fair 14.5% |
| Immigrants | Armenia | 27.2 /100 | #199 | Fair 14.5% |
| Panamanians | 25.1 /100 | #200 | Fair 14.4% |
| Scotch-Irish | 25.0 /100 | #201 | Fair 14.4% |
| Immigrants | Western Africa | 24.9 /100 | #202 | Fair 14.4% |
| Yugoslavians | 24.3 /100 | #203 | Fair 14.4% |
| French | 23.7 /100 | #204 | Fair 14.4% |
| Trinidadians and Tobagonians | 23.5 /100 | #205 | Fair 14.4% |
| Scandinavians | 23.3 /100 | #206 | Fair 14.4% |
| Immigrants | Bosnia and Herzegovina | 22.0 /100 | #207 | Fair 14.3% |
| Immigrants | Barbados | 20.5 /100 | #208 | Fair 14.3% |
| Immigrants | Panama | 20.0 /100 | #209 | Fair 14.3% |
| Sub-Saharan Africans | 19.4 /100 | #210 | Poor 14.2% |