Alaska Native vs Lumbee Associate's Degree
COMPARE
Alaska Native
Lumbee
Associate's Degree
Associate's Degree Comparison
Alaska Natives
Lumbee
37.5%
ASSOCIATE'S DEGREE
0.0/ 100
METRIC RATING
318th/ 347
METRIC RANK
34.1%
ASSOCIATE'S DEGREE
0.0/ 100
METRIC RATING
337th/ 347
METRIC RANK
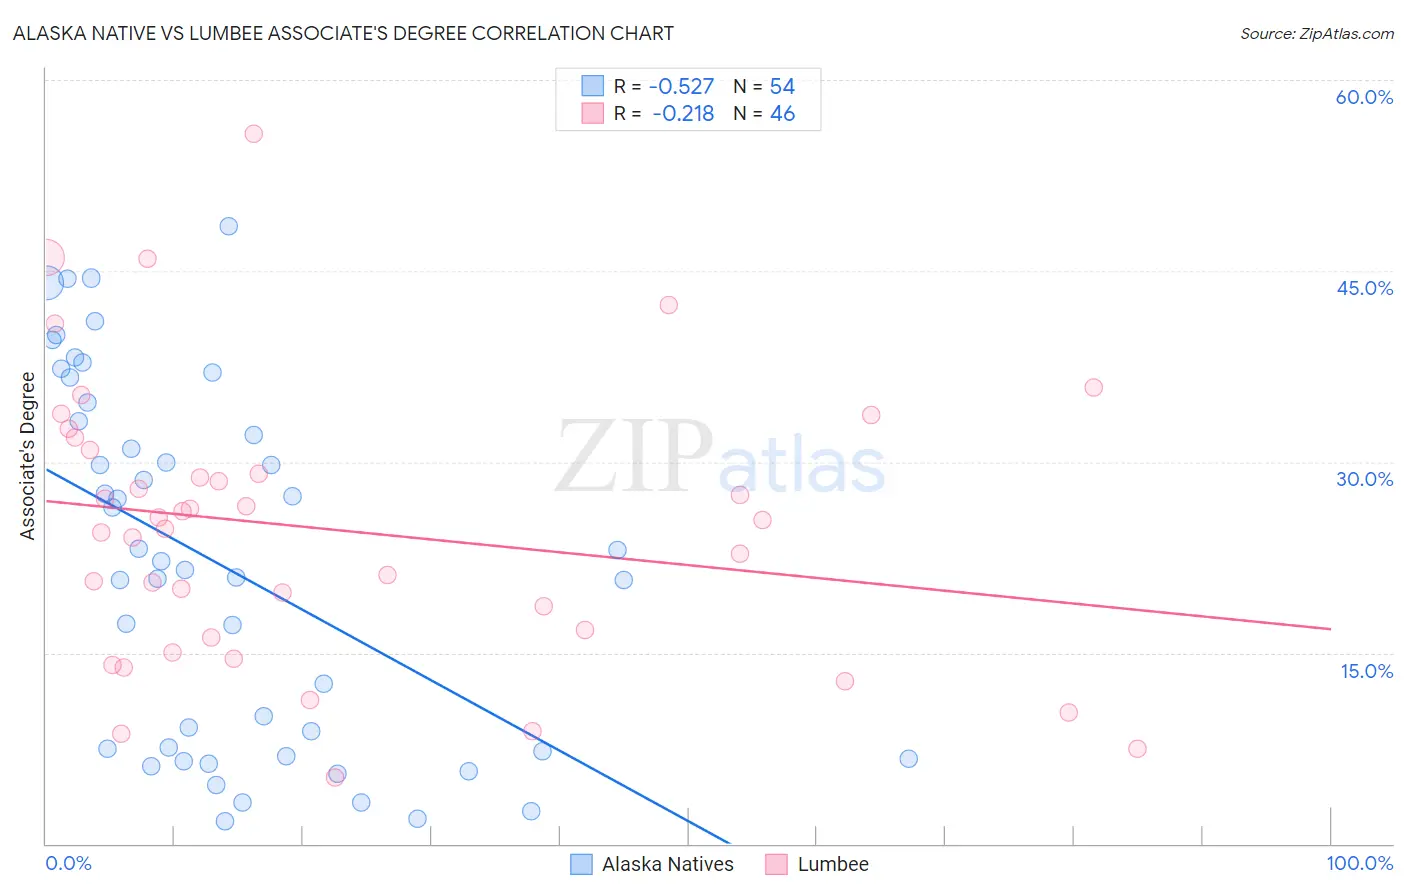
Alaska Native vs Lumbee Associate's Degree Correlation Chart
The statistical analysis conducted on geographies consisting of 76,777,220 people shows a substantial negative correlation between the proportion of Alaska Natives and percentage of population with at least associate's degree education in the United States with a correlation coefficient (R) of -0.527 and weighted average of 37.5%. Similarly, the statistical analysis conducted on geographies consisting of 92,299,068 people shows a weak negative correlation between the proportion of Lumbee and percentage of population with at least associate's degree education in the United States with a correlation coefficient (R) of -0.218 and weighted average of 34.1%, a difference of 9.8%.
Associate's Degree Correlation Summary
| Measurement | Alaska Native | Lumbee |
| Minimum | 1.8% | 5.2% |
| Maximum | 48.5% | 55.8% |
| Range | 46.7% | 50.6% |
| Mean | 21.8% | 24.7% |
| Median | 21.9% | 25.1% |
| Interquartile 25% (IQ1) | 7.3% | 16.2% |
| Interquartile 75% (IQ3) | 33.2% | 30.9% |
| Interquartile Range (IQR) | 25.9% | 14.7% |
| Standard Deviation (Sample) | 14.0% | 11.1% |
| Standard Deviation (Population) | 13.9% | 10.9% |
Demographics Similar to Alaska Natives and Lumbee by Associate's Degree
In terms of associate's degree, the demographic groups most similar to Alaska Natives are Fijian (37.4%, a difference of 0.22%), Yaqui (37.6%, a difference of 0.23%), Cajun (37.4%, a difference of 0.25%), Immigrants from Yemen (37.3%, a difference of 0.37%), and Pennsylvania German (37.2%, a difference of 0.66%). Similarly, the demographic groups most similar to Lumbee are Hopi (34.6%, a difference of 1.3%), Spanish American Indian (34.9%, a difference of 2.2%), Native/Alaskan (34.9%, a difference of 2.3%), Mexican (35.0%, a difference of 2.6%), and Immigrants from Central America (35.0%, a difference of 2.6%).
| Demographics | Rating | Rank | Associate's Degree |
| Yaqui | 0.0 /100 | #317 | Tragic 37.6% |
| Alaska Natives | 0.0 /100 | #318 | Tragic 37.5% |
| Fijians | 0.0 /100 | #319 | Tragic 37.4% |
| Cajuns | 0.0 /100 | #320 | Tragic 37.4% |
| Immigrants | Yemen | 0.0 /100 | #321 | Tragic 37.3% |
| Pennsylvania Germans | 0.0 /100 | #322 | Tragic 37.2% |
| Immigrants | Cabo Verde | 0.0 /100 | #323 | Tragic 36.8% |
| Arapaho | 0.0 /100 | #324 | Tragic 36.7% |
| Menominee | 0.0 /100 | #325 | Tragic 36.7% |
| Kiowa | 0.0 /100 | #326 | Tragic 36.5% |
| Dutch West Indians | 0.0 /100 | #327 | Tragic 36.5% |
| Alaskan Athabascans | 0.0 /100 | #328 | Tragic 36.5% |
| Paiute | 0.0 /100 | #329 | Tragic 36.4% |
| Apache | 0.0 /100 | #330 | Tragic 36.2% |
| Immigrants | Azores | 0.0 /100 | #331 | Tragic 35.6% |
| Immigrants | Central America | 0.0 /100 | #332 | Tragic 35.0% |
| Mexicans | 0.0 /100 | #333 | Tragic 35.0% |
| Natives/Alaskans | 0.0 /100 | #334 | Tragic 34.9% |
| Spanish American Indians | 0.0 /100 | #335 | Tragic 34.9% |
| Hopi | 0.0 /100 | #336 | Tragic 34.6% |
| Lumbee | 0.0 /100 | #337 | Tragic 34.1% |