Alaska Native vs Immigrants from Kenya Associate's Degree
COMPARE
Alaska Native
Immigrants from Kenya
Associate's Degree
Associate's Degree Comparison
Alaska Natives
Immigrants from Kenya
37.5%
ASSOCIATE'S DEGREE
0.0/ 100
METRIC RATING
318th/ 347
METRIC RANK
47.2%
ASSOCIATE'S DEGREE
72.1/ 100
METRIC RATING
154th/ 347
METRIC RANK
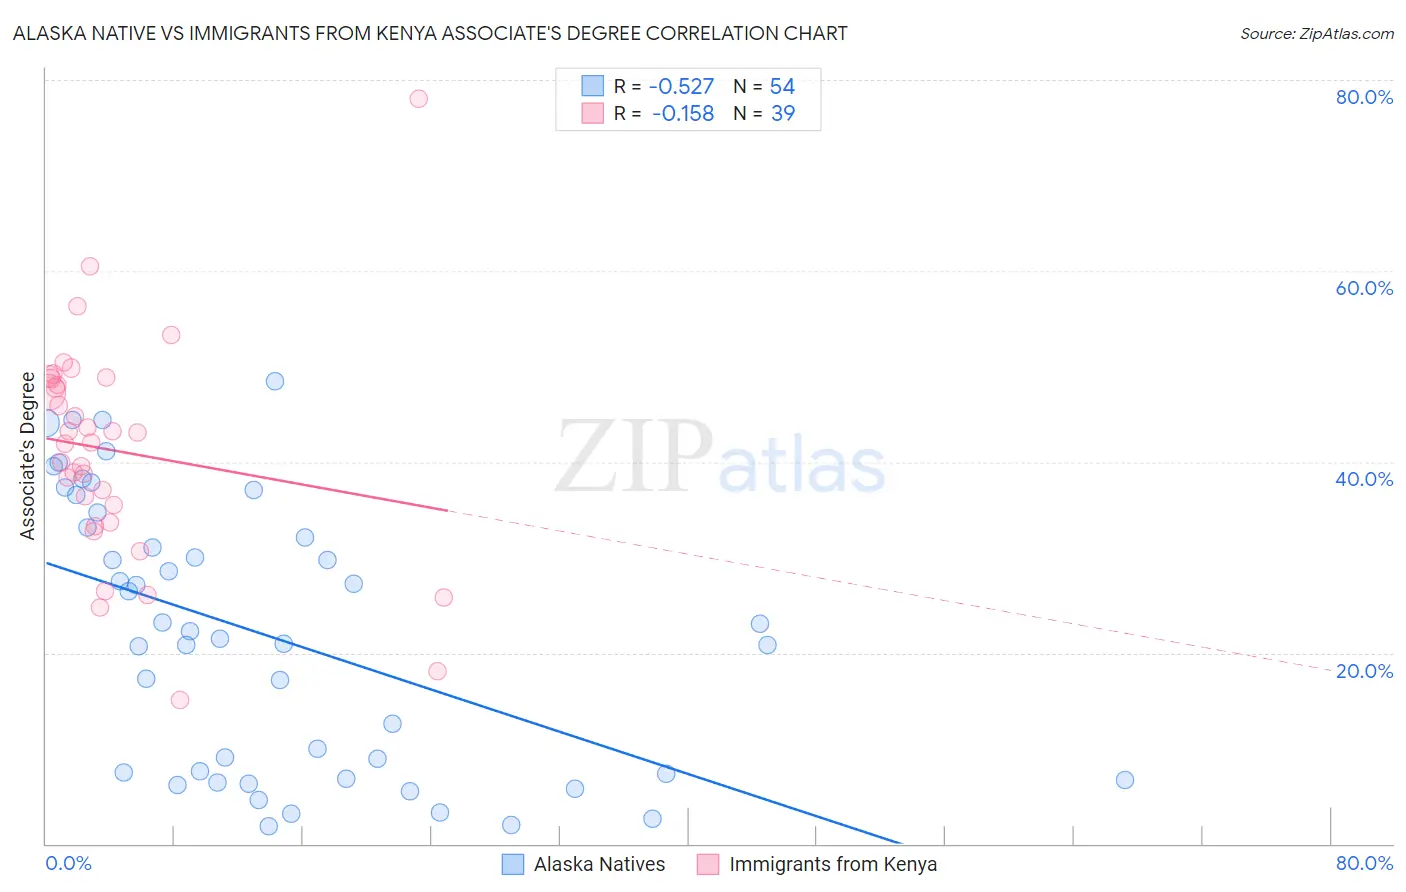
Alaska Native vs Immigrants from Kenya Associate's Degree Correlation Chart
The statistical analysis conducted on geographies consisting of 76,777,220 people shows a substantial negative correlation between the proportion of Alaska Natives and percentage of population with at least associate's degree education in the United States with a correlation coefficient (R) of -0.527 and weighted average of 37.5%. Similarly, the statistical analysis conducted on geographies consisting of 218,082,040 people shows a poor negative correlation between the proportion of Immigrants from Kenya and percentage of population with at least associate's degree education in the United States with a correlation coefficient (R) of -0.158 and weighted average of 47.2%, a difference of 25.9%.
Associate's Degree Correlation Summary
| Measurement | Alaska Native | Immigrants from Kenya |
| Minimum | 1.8% | 15.0% |
| Maximum | 48.5% | 78.0% |
| Range | 46.7% | 63.0% |
| Mean | 21.8% | 41.2% |
| Median | 21.9% | 42.0% |
| Interquartile 25% (IQ1) | 7.3% | 33.7% |
| Interquartile 75% (IQ3) | 33.2% | 48.8% |
| Interquartile Range (IQR) | 25.9% | 15.1% |
| Standard Deviation (Sample) | 14.0% | 11.8% |
| Standard Deviation (Population) | 13.9% | 11.6% |
Similar Demographics by Associate's Degree
Demographics Similar to Alaska Natives by Associate's Degree
In terms of associate's degree, the demographic groups most similar to Alaska Natives are Fijian (37.4%, a difference of 0.22%), Yaqui (37.6%, a difference of 0.23%), Crow (37.6%, a difference of 0.25%), Cajun (37.4%, a difference of 0.25%), and Creek (37.6%, a difference of 0.26%).
| Demographics | Rating | Rank | Associate's Degree |
| Immigrants | Latin America | 0.0 /100 | #311 | Tragic 37.9% |
| Choctaw | 0.0 /100 | #312 | Tragic 37.8% |
| Hispanics or Latinos | 0.0 /100 | #313 | Tragic 37.7% |
| Seminole | 0.0 /100 | #314 | Tragic 37.7% |
| Creek | 0.0 /100 | #315 | Tragic 37.6% |
| Crow | 0.0 /100 | #316 | Tragic 37.6% |
| Yaqui | 0.0 /100 | #317 | Tragic 37.6% |
| Alaska Natives | 0.0 /100 | #318 | Tragic 37.5% |
| Fijians | 0.0 /100 | #319 | Tragic 37.4% |
| Cajuns | 0.0 /100 | #320 | Tragic 37.4% |
| Immigrants | Yemen | 0.0 /100 | #321 | Tragic 37.3% |
| Pennsylvania Germans | 0.0 /100 | #322 | Tragic 37.2% |
| Immigrants | Cabo Verde | 0.0 /100 | #323 | Tragic 36.8% |
| Arapaho | 0.0 /100 | #324 | Tragic 36.7% |
| Menominee | 0.0 /100 | #325 | Tragic 36.7% |
Demographics Similar to Immigrants from Kenya by Associate's Degree
In terms of associate's degree, the demographic groups most similar to Immigrants from Kenya are Czech (47.2%, a difference of 0.010%), Kenyan (47.1%, a difference of 0.13%), South American (47.1%, a difference of 0.14%), Sudanese (47.1%, a difference of 0.16%), and Immigrants from Afghanistan (47.3%, a difference of 0.20%).
| Demographics | Rating | Rank | Associate's Degree |
| Danes | 77.3 /100 | #147 | Good 47.4% |
| South American Indians | 76.7 /100 | #148 | Good 47.4% |
| Immigrants | Armenia | 76.6 /100 | #149 | Good 47.4% |
| Iraqis | 76.2 /100 | #150 | Good 47.4% |
| Immigrants | North Macedonia | 76.0 /100 | #151 | Good 47.4% |
| Immigrants | Afghanistan | 74.3 /100 | #152 | Good 47.3% |
| Czechs | 72.2 /100 | #153 | Good 47.2% |
| Immigrants | Kenya | 72.1 /100 | #154 | Good 47.2% |
| Kenyans | 70.6 /100 | #155 | Good 47.1% |
| South Americans | 70.5 /100 | #156 | Good 47.1% |
| Sudanese | 70.3 /100 | #157 | Good 47.1% |
| Immigrants | Germany | 69.7 /100 | #158 | Good 47.1% |
| Immigrants | Poland | 69.2 /100 | #159 | Good 47.1% |
| Scottish | 65.4 /100 | #160 | Good 46.9% |
| Scandinavians | 65.2 /100 | #161 | Good 46.9% |