Alaska Native vs Immigrants from India Associate's Degree
COMPARE
Alaska Native
Immigrants from India
Associate's Degree
Associate's Degree Comparison
Alaska Natives
Immigrants from India
37.5%
ASSOCIATE'S DEGREE
0.0/ 100
METRIC RATING
318th/ 347
METRIC RANK
58.5%
ASSOCIATE'S DEGREE
100.0/ 100
METRIC RATING
3rd/ 347
METRIC RANK
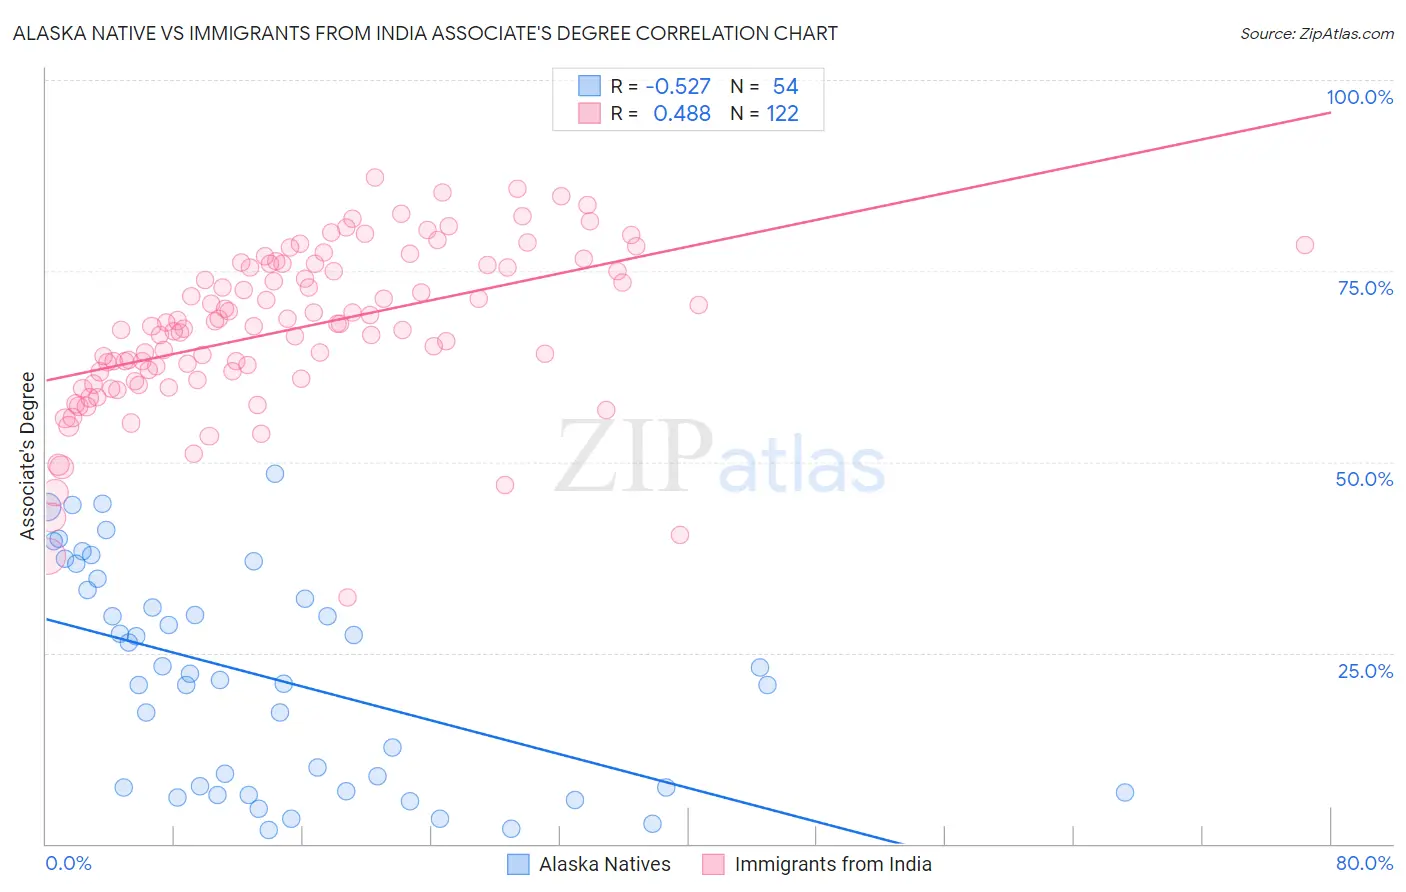
Alaska Native vs Immigrants from India Associate's Degree Correlation Chart
The statistical analysis conducted on geographies consisting of 76,777,220 people shows a substantial negative correlation between the proportion of Alaska Natives and percentage of population with at least associate's degree education in the United States with a correlation coefficient (R) of -0.527 and weighted average of 37.5%. Similarly, the statistical analysis conducted on geographies consisting of 434,068,008 people shows a moderate positive correlation between the proportion of Immigrants from India and percentage of population with at least associate's degree education in the United States with a correlation coefficient (R) of 0.488 and weighted average of 58.5%, a difference of 56.3%.
Associate's Degree Correlation Summary
| Measurement | Alaska Native | Immigrants from India |
| Minimum | 1.8% | 32.2% |
| Maximum | 48.5% | 87.3% |
| Range | 46.7% | 55.1% |
| Mean | 21.8% | 67.4% |
| Median | 21.9% | 67.9% |
| Interquartile 25% (IQ1) | 7.3% | 60.9% |
| Interquartile 75% (IQ3) | 33.2% | 75.8% |
| Interquartile Range (IQR) | 25.9% | 14.8% |
| Standard Deviation (Sample) | 14.0% | 10.5% |
| Standard Deviation (Population) | 13.9% | 10.5% |
Similar Demographics by Associate's Degree
Demographics Similar to Alaska Natives by Associate's Degree
In terms of associate's degree, the demographic groups most similar to Alaska Natives are Fijian (37.4%, a difference of 0.22%), Yaqui (37.6%, a difference of 0.23%), Crow (37.6%, a difference of 0.25%), Cajun (37.4%, a difference of 0.25%), and Creek (37.6%, a difference of 0.26%).
| Demographics | Rating | Rank | Associate's Degree |
| Immigrants | Latin America | 0.0 /100 | #311 | Tragic 37.9% |
| Choctaw | 0.0 /100 | #312 | Tragic 37.8% |
| Hispanics or Latinos | 0.0 /100 | #313 | Tragic 37.7% |
| Seminole | 0.0 /100 | #314 | Tragic 37.7% |
| Creek | 0.0 /100 | #315 | Tragic 37.6% |
| Crow | 0.0 /100 | #316 | Tragic 37.6% |
| Yaqui | 0.0 /100 | #317 | Tragic 37.6% |
| Alaska Natives | 0.0 /100 | #318 | Tragic 37.5% |
| Fijians | 0.0 /100 | #319 | Tragic 37.4% |
| Cajuns | 0.0 /100 | #320 | Tragic 37.4% |
| Immigrants | Yemen | 0.0 /100 | #321 | Tragic 37.3% |
| Pennsylvania Germans | 0.0 /100 | #322 | Tragic 37.2% |
| Immigrants | Cabo Verde | 0.0 /100 | #323 | Tragic 36.8% |
| Arapaho | 0.0 /100 | #324 | Tragic 36.7% |
| Menominee | 0.0 /100 | #325 | Tragic 36.7% |
Demographics Similar to Immigrants from India by Associate's Degree
In terms of associate's degree, the demographic groups most similar to Immigrants from India are Immigrants from Taiwan (58.4%, a difference of 0.25%), Immigrants from Singapore (58.9%, a difference of 0.66%), Iranian (58.2%, a difference of 0.66%), Okinawan (57.7%, a difference of 1.5%), and Immigrants from Iran (57.7%, a difference of 1.5%).
| Demographics | Rating | Rank | Associate's Degree |
| Filipinos | 100.0 /100 | #1 | Exceptional 59.8% |
| Immigrants | Singapore | 100.0 /100 | #2 | Exceptional 58.9% |
| Immigrants | India | 100.0 /100 | #3 | Exceptional 58.5% |
| Immigrants | Taiwan | 100.0 /100 | #4 | Exceptional 58.4% |
| Iranians | 100.0 /100 | #5 | Exceptional 58.2% |
| Okinawans | 100.0 /100 | #6 | Exceptional 57.7% |
| Immigrants | Iran | 100.0 /100 | #7 | Exceptional 57.7% |
| Thais | 100.0 /100 | #8 | Exceptional 57.4% |
| Immigrants | Israel | 100.0 /100 | #9 | Exceptional 56.8% |
| Cypriots | 100.0 /100 | #10 | Exceptional 56.4% |
| Immigrants | Australia | 100.0 /100 | #11 | Exceptional 55.8% |
| Immigrants | South Central Asia | 100.0 /100 | #12 | Exceptional 55.7% |
| Immigrants | China | 100.0 /100 | #13 | Exceptional 55.5% |
| Immigrants | Hong Kong | 100.0 /100 | #14 | Exceptional 55.4% |
| Immigrants | Eastern Asia | 100.0 /100 | #15 | Exceptional 55.4% |