White/Caucasian vs Lumbee Associate's Degree
COMPARE
White/Caucasian
Lumbee
Associate's Degree
Associate's Degree Comparison
Whites/Caucasians
Lumbee
44.2%
ASSOCIATE'S DEGREE
7.5/ 100
METRIC RATING
219th/ 347
METRIC RANK
34.1%
ASSOCIATE'S DEGREE
0.0/ 100
METRIC RATING
337th/ 347
METRIC RANK
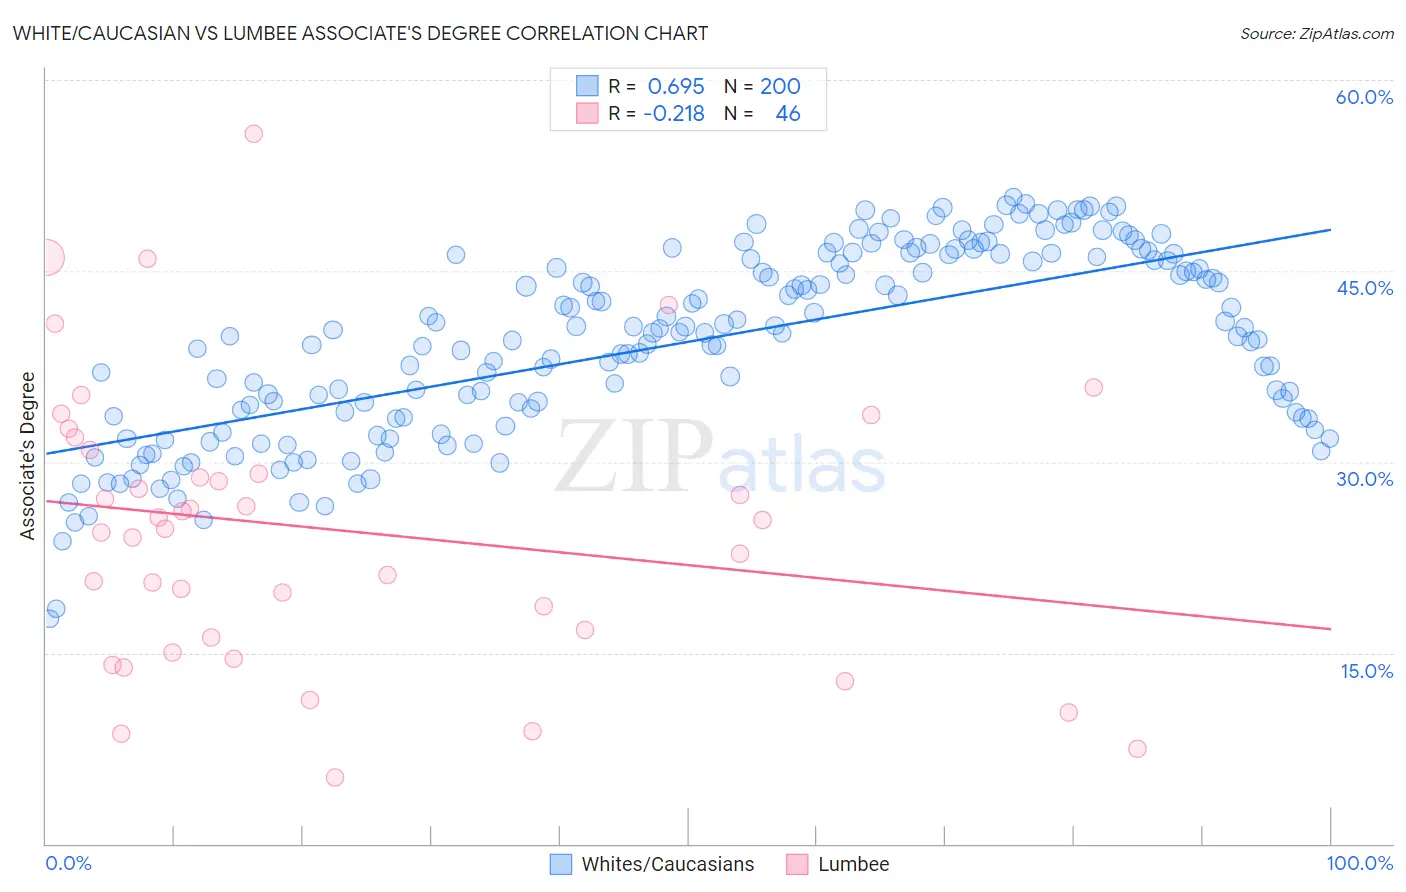
White/Caucasian vs Lumbee Associate's Degree Correlation Chart
The statistical analysis conducted on geographies consisting of 584,984,374 people shows a significant positive correlation between the proportion of Whites/Caucasians and percentage of population with at least associate's degree education in the United States with a correlation coefficient (R) of 0.695 and weighted average of 44.2%. Similarly, the statistical analysis conducted on geographies consisting of 92,299,068 people shows a weak negative correlation between the proportion of Lumbee and percentage of population with at least associate's degree education in the United States with a correlation coefficient (R) of -0.218 and weighted average of 34.1%, a difference of 29.5%.
Associate's Degree Correlation Summary
| Measurement | White/Caucasian | Lumbee |
| Minimum | 17.7% | 5.2% |
| Maximum | 50.8% | 55.8% |
| Range | 33.1% | 50.6% |
| Mean | 39.4% | 24.7% |
| Median | 40.2% | 25.1% |
| Interquartile 25% (IQ1) | 33.5% | 16.2% |
| Interquartile 75% (IQ3) | 46.2% | 30.9% |
| Interquartile Range (IQR) | 12.6% | 14.7% |
| Standard Deviation (Sample) | 7.3% | 11.1% |
| Standard Deviation (Population) | 7.3% | 10.9% |
Similar Demographics by Associate's Degree
Demographics Similar to Whites/Caucasians by Associate's Degree
In terms of associate's degree, the demographic groups most similar to Whites/Caucasians are Portuguese (44.1%, a difference of 0.070%), Immigrants from Western Africa (44.1%, a difference of 0.27%), Spanish (44.4%, a difference of 0.48%), Barbadian (43.9%, a difference of 0.54%), and Subsaharan African (43.9%, a difference of 0.64%).
| Demographics | Rating | Rank | Associate's Degree |
| French Canadians | 15.0 /100 | #212 | Poor 44.9% |
| Immigrants | Ghana | 14.2 /100 | #213 | Poor 44.8% |
| Immigrants | Middle Africa | 12.7 /100 | #214 | Poor 44.7% |
| Immigrants | Panama | 12.4 /100 | #215 | Poor 44.7% |
| Immigrants | Nigeria | 11.4 /100 | #216 | Poor 44.6% |
| Immigrants | Immigrants | 10.5 /100 | #217 | Poor 44.5% |
| Spanish | 9.4 /100 | #218 | Tragic 44.4% |
| Whites/Caucasians | 7.5 /100 | #219 | Tragic 44.2% |
| Portuguese | 7.2 /100 | #220 | Tragic 44.1% |
| Immigrants | Western Africa | 6.6 /100 | #221 | Tragic 44.1% |
| Barbadians | 5.8 /100 | #222 | Tragic 43.9% |
| Sub-Saharan Africans | 5.5 /100 | #223 | Tragic 43.9% |
| West Indians | 5.2 /100 | #224 | Tragic 43.8% |
| Guamanians/Chamorros | 4.8 /100 | #225 | Tragic 43.8% |
| Immigrants | Burma/Myanmar | 4.3 /100 | #226 | Tragic 43.7% |
Demographics Similar to Lumbee by Associate's Degree
In terms of associate's degree, the demographic groups most similar to Lumbee are Pueblo (34.0%, a difference of 0.41%), Immigrants from Mexico (33.7%, a difference of 1.1%), Hopi (34.6%, a difference of 1.3%), Spanish American Indian (34.9%, a difference of 2.2%), and Native/Alaskan (34.9%, a difference of 2.3%).
| Demographics | Rating | Rank | Associate's Degree |
| Apache | 0.0 /100 | #330 | Tragic 36.2% |
| Immigrants | Azores | 0.0 /100 | #331 | Tragic 35.6% |
| Immigrants | Central America | 0.0 /100 | #332 | Tragic 35.0% |
| Mexicans | 0.0 /100 | #333 | Tragic 35.0% |
| Natives/Alaskans | 0.0 /100 | #334 | Tragic 34.9% |
| Spanish American Indians | 0.0 /100 | #335 | Tragic 34.9% |
| Hopi | 0.0 /100 | #336 | Tragic 34.6% |
| Lumbee | 0.0 /100 | #337 | Tragic 34.1% |
| Pueblo | 0.0 /100 | #338 | Tragic 34.0% |
| Immigrants | Mexico | 0.0 /100 | #339 | Tragic 33.7% |
| Navajo | 0.0 /100 | #340 | Tragic 32.6% |
| Inupiat | 0.0 /100 | #341 | Tragic 32.6% |
| Yakama | 0.0 /100 | #342 | Tragic 32.3% |
| Tohono O'odham | 0.0 /100 | #343 | Tragic 31.8% |
| Yuman | 0.0 /100 | #344 | Tragic 31.3% |