Alaska Native vs Canadian Associate's Degree
COMPARE
Alaska Native
Canadian
Associate's Degree
Associate's Degree Comparison
Alaska Natives
Canadians
37.5%
ASSOCIATE'S DEGREE
0.0/ 100
METRIC RATING
318th/ 347
METRIC RANK
47.5%
ASSOCIATE'S DEGREE
79.0/ 100
METRIC RATING
145th/ 347
METRIC RANK
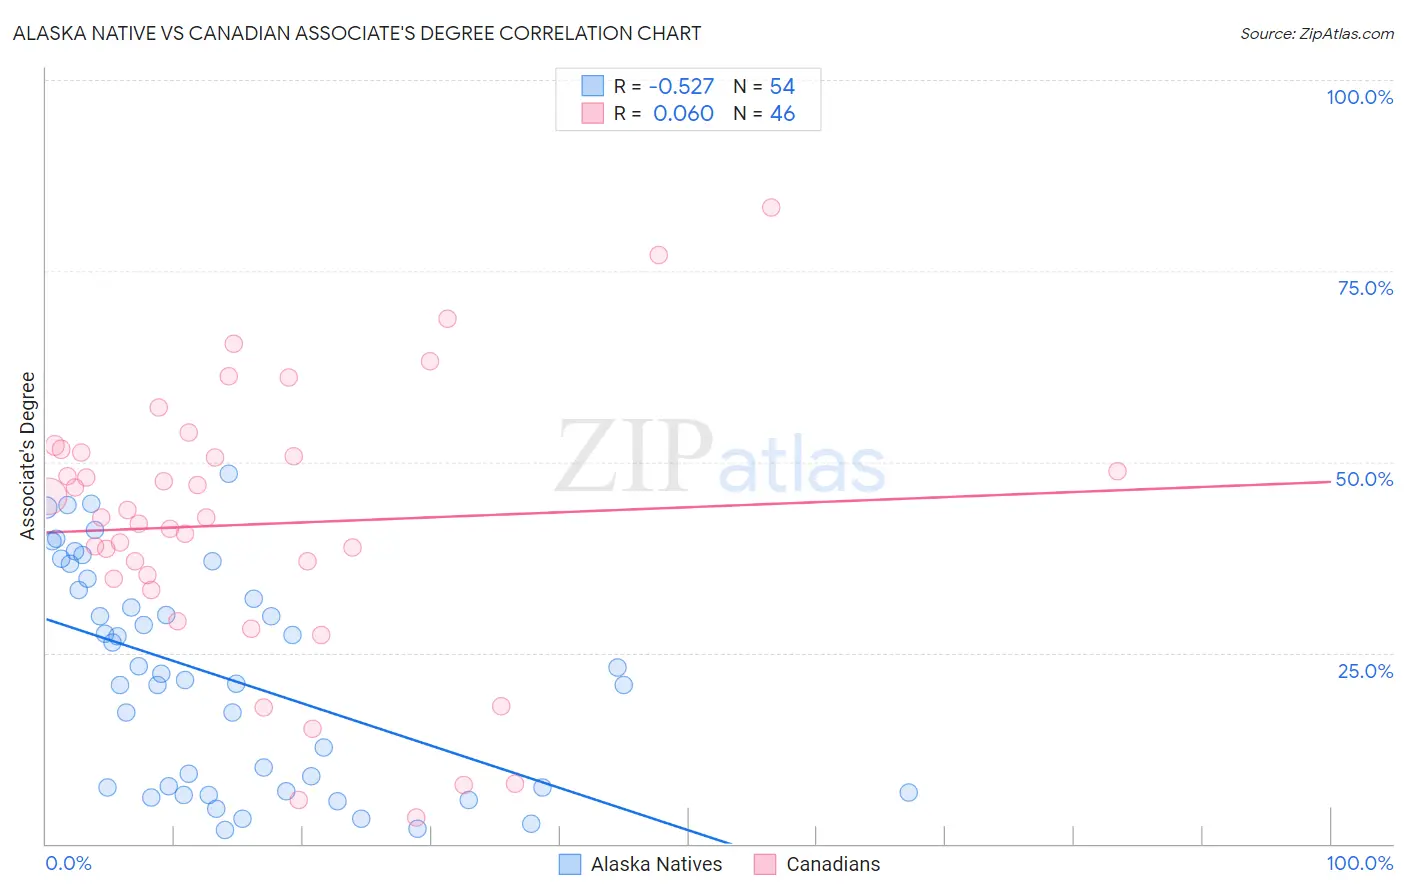
Alaska Native vs Canadian Associate's Degree Correlation Chart
The statistical analysis conducted on geographies consisting of 76,777,220 people shows a substantial negative correlation between the proportion of Alaska Natives and percentage of population with at least associate's degree education in the United States with a correlation coefficient (R) of -0.527 and weighted average of 37.5%. Similarly, the statistical analysis conducted on geographies consisting of 437,535,848 people shows a slight positive correlation between the proportion of Canadians and percentage of population with at least associate's degree education in the United States with a correlation coefficient (R) of 0.060 and weighted average of 47.5%, a difference of 26.8%.
Associate's Degree Correlation Summary
| Measurement | Alaska Native | Canadian |
| Minimum | 1.8% | 3.4% |
| Maximum | 48.5% | 83.3% |
| Range | 46.7% | 80.0% |
| Mean | 21.8% | 41.8% |
| Median | 21.9% | 42.7% |
| Interquartile 25% (IQ1) | 7.3% | 34.7% |
| Interquartile 75% (IQ3) | 33.2% | 51.3% |
| Interquartile Range (IQR) | 25.9% | 16.6% |
| Standard Deviation (Sample) | 14.0% | 17.8% |
| Standard Deviation (Population) | 13.9% | 17.6% |
Similar Demographics by Associate's Degree
Demographics Similar to Alaska Natives by Associate's Degree
In terms of associate's degree, the demographic groups most similar to Alaska Natives are Fijian (37.4%, a difference of 0.22%), Yaqui (37.6%, a difference of 0.23%), Crow (37.6%, a difference of 0.25%), Cajun (37.4%, a difference of 0.25%), and Creek (37.6%, a difference of 0.26%).
| Demographics | Rating | Rank | Associate's Degree |
| Immigrants | Latin America | 0.0 /100 | #311 | Tragic 37.9% |
| Choctaw | 0.0 /100 | #312 | Tragic 37.8% |
| Hispanics or Latinos | 0.0 /100 | #313 | Tragic 37.7% |
| Seminole | 0.0 /100 | #314 | Tragic 37.7% |
| Creek | 0.0 /100 | #315 | Tragic 37.6% |
| Crow | 0.0 /100 | #316 | Tragic 37.6% |
| Yaqui | 0.0 /100 | #317 | Tragic 37.6% |
| Alaska Natives | 0.0 /100 | #318 | Tragic 37.5% |
| Fijians | 0.0 /100 | #319 | Tragic 37.4% |
| Cajuns | 0.0 /100 | #320 | Tragic 37.4% |
| Immigrants | Yemen | 0.0 /100 | #321 | Tragic 37.3% |
| Pennsylvania Germans | 0.0 /100 | #322 | Tragic 37.2% |
| Immigrants | Cabo Verde | 0.0 /100 | #323 | Tragic 36.8% |
| Arapaho | 0.0 /100 | #324 | Tragic 36.7% |
| Menominee | 0.0 /100 | #325 | Tragic 36.7% |
Demographics Similar to Canadians by Associate's Degree
In terms of associate's degree, the demographic groups most similar to Canadians are Immigrants from Sudan (47.4%, a difference of 0.13%), Slavic (47.6%, a difference of 0.17%), Danish (47.4%, a difference of 0.18%), Norwegian (47.6%, a difference of 0.23%), and South American Indian (47.4%, a difference of 0.24%).
| Demographics | Rating | Rank | Associate's Degree |
| Poles | 87.3 /100 | #138 | Excellent 48.0% |
| Slovenes | 85.1 /100 | #139 | Excellent 47.9% |
| Immigrants | Southern Europe | 84.4 /100 | #140 | Excellent 47.8% |
| Taiwanese | 83.3 /100 | #141 | Excellent 47.7% |
| Sierra Leoneans | 82.9 /100 | #142 | Excellent 47.7% |
| Norwegians | 81.0 /100 | #143 | Excellent 47.6% |
| Slavs | 80.5 /100 | #144 | Excellent 47.6% |
| Canadians | 79.0 /100 | #145 | Good 47.5% |
| Immigrants | Sudan | 77.9 /100 | #146 | Good 47.4% |
| Danes | 77.3 /100 | #147 | Good 47.4% |
| South American Indians | 76.7 /100 | #148 | Good 47.4% |
| Immigrants | Armenia | 76.6 /100 | #149 | Good 47.4% |
| Iraqis | 76.2 /100 | #150 | Good 47.4% |
| Immigrants | North Macedonia | 76.0 /100 | #151 | Good 47.4% |
| Immigrants | Afghanistan | 74.3 /100 | #152 | Good 47.3% |