Alaska Native vs Assyrian/Chaldean/Syriac Associate's Degree
COMPARE
Alaska Native
Assyrian/Chaldean/Syriac
Associate's Degree
Associate's Degree Comparison
Alaska Natives
Assyrians/Chaldeans/Syriacs
37.5%
ASSOCIATE'S DEGREE
0.0/ 100
METRIC RATING
318th/ 347
METRIC RANK
48.2%
ASSOCIATE'S DEGREE
89.4/ 100
METRIC RATING
133rd/ 347
METRIC RANK
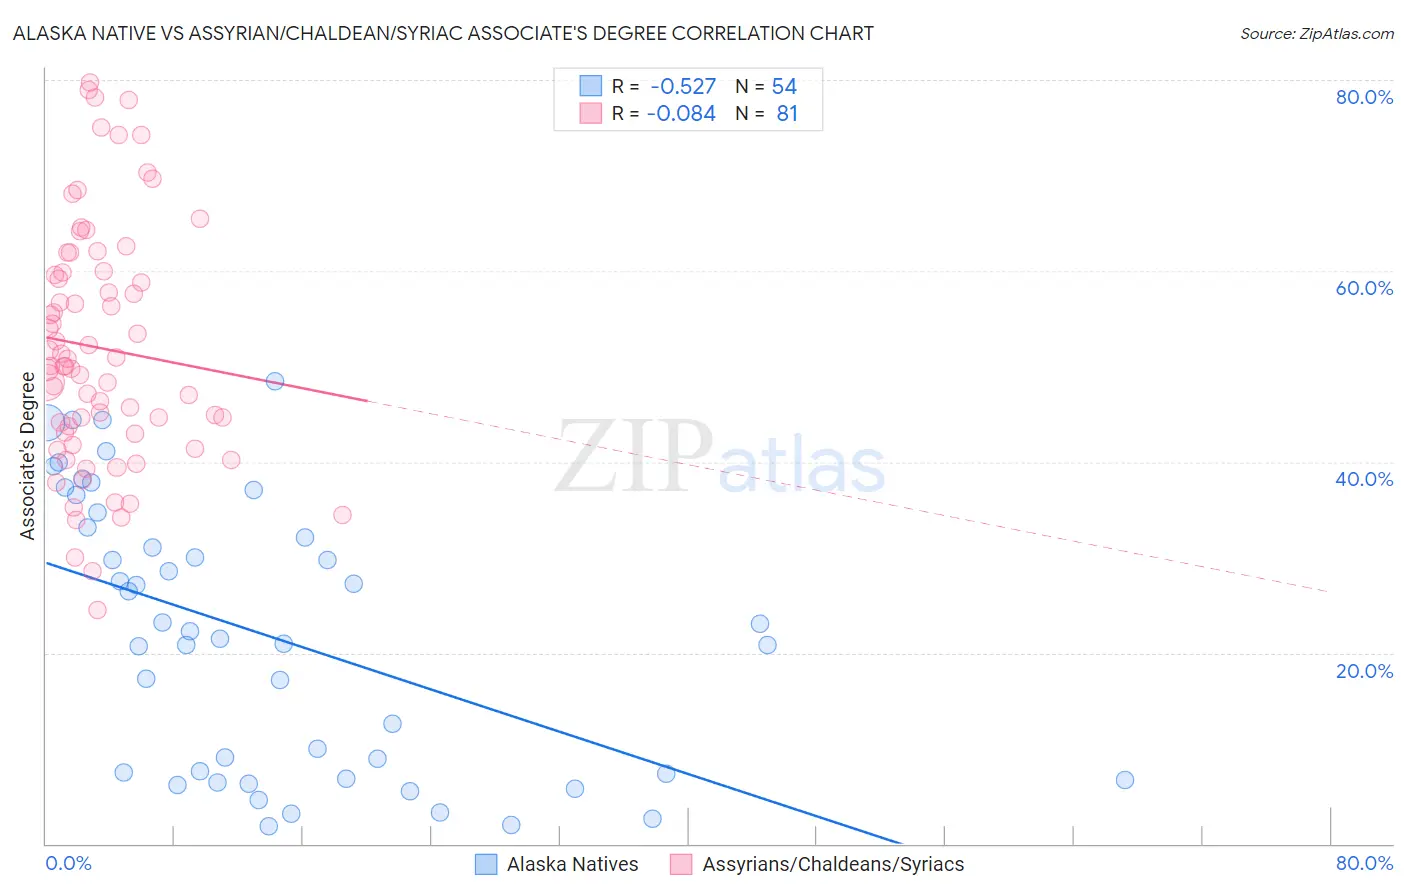
Alaska Native vs Assyrian/Chaldean/Syriac Associate's Degree Correlation Chart
The statistical analysis conducted on geographies consisting of 76,777,220 people shows a substantial negative correlation between the proportion of Alaska Natives and percentage of population with at least associate's degree education in the United States with a correlation coefficient (R) of -0.527 and weighted average of 37.5%. Similarly, the statistical analysis conducted on geographies consisting of 110,318,304 people shows a slight negative correlation between the proportion of Assyrians/Chaldeans/Syriacs and percentage of population with at least associate's degree education in the United States with a correlation coefficient (R) of -0.084 and weighted average of 48.2%, a difference of 28.7%.
Associate's Degree Correlation Summary
| Measurement | Alaska Native | Assyrian/Chaldean/Syriac |
| Minimum | 1.8% | 24.5% |
| Maximum | 48.5% | 79.8% |
| Range | 46.7% | 55.3% |
| Mean | 21.8% | 51.9% |
| Median | 21.9% | 50.1% |
| Interquartile 25% (IQ1) | 7.3% | 43.0% |
| Interquartile 75% (IQ3) | 33.2% | 59.9% |
| Interquartile Range (IQR) | 25.9% | 16.9% |
| Standard Deviation (Sample) | 14.0% | 12.7% |
| Standard Deviation (Population) | 13.9% | 12.6% |
Similar Demographics by Associate's Degree
Demographics Similar to Alaska Natives by Associate's Degree
In terms of associate's degree, the demographic groups most similar to Alaska Natives are Fijian (37.4%, a difference of 0.22%), Yaqui (37.6%, a difference of 0.23%), Crow (37.6%, a difference of 0.25%), Cajun (37.4%, a difference of 0.25%), and Creek (37.6%, a difference of 0.26%).
| Demographics | Rating | Rank | Associate's Degree |
| Immigrants | Latin America | 0.0 /100 | #311 | Tragic 37.9% |
| Choctaw | 0.0 /100 | #312 | Tragic 37.8% |
| Hispanics or Latinos | 0.0 /100 | #313 | Tragic 37.7% |
| Seminole | 0.0 /100 | #314 | Tragic 37.7% |
| Creek | 0.0 /100 | #315 | Tragic 37.6% |
| Crow | 0.0 /100 | #316 | Tragic 37.6% |
| Yaqui | 0.0 /100 | #317 | Tragic 37.6% |
| Alaska Natives | 0.0 /100 | #318 | Tragic 37.5% |
| Fijians | 0.0 /100 | #319 | Tragic 37.4% |
| Cajuns | 0.0 /100 | #320 | Tragic 37.4% |
| Immigrants | Yemen | 0.0 /100 | #321 | Tragic 37.3% |
| Pennsylvania Germans | 0.0 /100 | #322 | Tragic 37.2% |
| Immigrants | Cabo Verde | 0.0 /100 | #323 | Tragic 36.8% |
| Arapaho | 0.0 /100 | #324 | Tragic 36.7% |
| Menominee | 0.0 /100 | #325 | Tragic 36.7% |
Demographics Similar to Assyrians/Chaldeans/Syriacs by Associate's Degree
In terms of associate's degree, the demographic groups most similar to Assyrians/Chaldeans/Syriacs are Moroccan (48.2%, a difference of 0.020%), Immigrants from Albania (48.2%, a difference of 0.080%), European (48.2%, a difference of 0.080%), Pakistani (48.1%, a difference of 0.26%), and Icelander (48.3%, a difference of 0.27%).
| Demographics | Rating | Rank | Associate's Degree |
| Immigrants | Syria | 92.2 /100 | #126 | Exceptional 48.5% |
| Immigrants | Uganda | 92.1 /100 | #127 | Exceptional 48.5% |
| Immigrants | Eastern Africa | 91.6 /100 | #128 | Exceptional 48.4% |
| Swedes | 91.5 /100 | #129 | Exceptional 48.4% |
| Immigrants | Jordan | 91.2 /100 | #130 | Exceptional 48.4% |
| Icelanders | 90.8 /100 | #131 | Exceptional 48.3% |
| Immigrants | Albania | 89.9 /100 | #132 | Excellent 48.2% |
| Assyrians/Chaldeans/Syriacs | 89.4 /100 | #133 | Excellent 48.2% |
| Moroccans | 89.3 /100 | #134 | Excellent 48.2% |
| Europeans | 89.0 /100 | #135 | Excellent 48.2% |
| Pakistanis | 88.0 /100 | #136 | Excellent 48.1% |
| Immigrants | Eritrea | 87.8 /100 | #137 | Excellent 48.1% |
| Poles | 87.3 /100 | #138 | Excellent 48.0% |
| Slovenes | 85.1 /100 | #139 | Excellent 47.9% |
| Immigrants | Southern Europe | 84.4 /100 | #140 | Excellent 47.8% |