Alaska Native vs Lumbee Unemployment Among Ages 45 to 54 years
COMPARE
Alaska Native
Lumbee
Unemployment Among Ages 45 to 54 years
Unemployment Among Ages 45 to 54 years Comparison
Alaska Natives
Lumbee
6.3%
UNEMPLOYMENT AMONG AGES 45 TO 54 YEARS
0.0/ 100
METRIC RATING
329th/ 347
METRIC RANK
4.6%
UNEMPLOYMENT AMONG AGES 45 TO 54 YEARS
9.2/ 100
METRIC RATING
216th/ 347
METRIC RANK
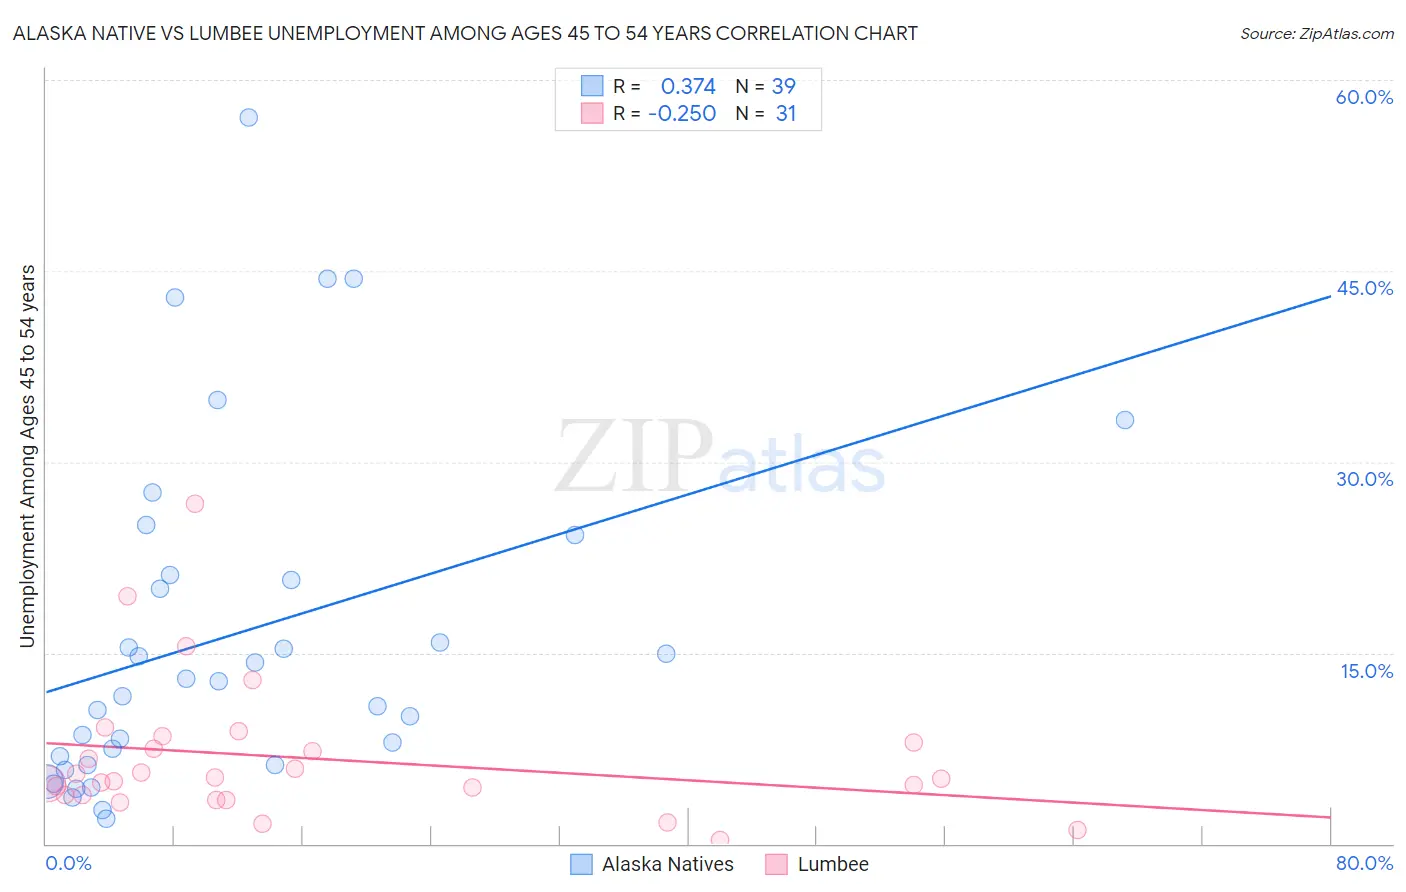
Alaska Native vs Lumbee Unemployment Among Ages 45 to 54 years Correlation Chart
The statistical analysis conducted on geographies consisting of 76,173,782 people shows a mild positive correlation between the proportion of Alaska Natives and unemployment rate among population between the ages 45 and 54 in the United States with a correlation coefficient (R) of 0.374 and weighted average of 6.3%. Similarly, the statistical analysis conducted on geographies consisting of 91,020,578 people shows a weak negative correlation between the proportion of Lumbee and unemployment rate among population between the ages 45 and 54 in the United States with a correlation coefficient (R) of -0.250 and weighted average of 4.6%, a difference of 34.8%.
Unemployment Among Ages 45 to 54 years Correlation Summary
| Measurement | Alaska Native | Lumbee |
| Minimum | 1.9% | 0.30% |
| Maximum | 57.1% | 26.7% |
| Range | 55.2% | 26.4% |
| Mean | 16.4% | 6.7% |
| Median | 12.8% | 5.1% |
| Interquartile 25% (IQ1) | 6.2% | 3.8% |
| Interquartile 75% (IQ3) | 21.1% | 8.0% |
| Interquartile Range (IQR) | 14.9% | 4.2% |
| Standard Deviation (Sample) | 13.4% | 5.5% |
| Standard Deviation (Population) | 13.3% | 5.4% |
Similar Demographics by Unemployment Among Ages 45 to 54 years
Demographics Similar to Alaska Natives by Unemployment Among Ages 45 to 54 years
In terms of unemployment among ages 45 to 54 years, the demographic groups most similar to Alaska Natives are Immigrants from Dominican Republic (6.3%, a difference of 0.13%), Tohono O'odham (6.3%, a difference of 0.18%), Pueblo (6.2%, a difference of 0.70%), Dominican (6.2%, a difference of 0.91%), and Ute (6.2%, a difference of 1.1%).
| Demographics | Rating | Rank | Unemployment Among Ages 45 to 54 years |
| Immigrants | Azores | 0.0 /100 | #322 | Tragic 5.7% |
| Immigrants | Cabo Verde | 0.0 /100 | #323 | Tragic 5.9% |
| Natives/Alaskans | 0.0 /100 | #324 | Tragic 6.1% |
| Immigrants | Armenia | 0.0 /100 | #325 | Tragic 6.1% |
| Ute | 0.0 /100 | #326 | Tragic 6.2% |
| Dominicans | 0.0 /100 | #327 | Tragic 6.2% |
| Pueblo | 0.0 /100 | #328 | Tragic 6.2% |
| Alaska Natives | 0.0 /100 | #329 | Tragic 6.3% |
| Immigrants | Dominican Republic | 0.0 /100 | #330 | Tragic 6.3% |
| Tohono O'odham | 0.0 /100 | #331 | Tragic 6.3% |
| Pima | 0.0 /100 | #332 | Tragic 6.4% |
| Immigrants | Yemen | 0.0 /100 | #333 | Tragic 6.5% |
| Sioux | 0.0 /100 | #334 | Tragic 6.6% |
| Navajo | 0.0 /100 | #335 | Tragic 6.7% |
| Puerto Ricans | 0.0 /100 | #336 | Tragic 6.8% |
Demographics Similar to Lumbee by Unemployment Among Ages 45 to 54 years
In terms of unemployment among ages 45 to 54 years, the demographic groups most similar to Lumbee are Immigrants from Panama (4.6%, a difference of 0.15%), Cherokee (4.6%, a difference of 0.18%), Panamanian (4.6%, a difference of 0.20%), Immigrants from Cambodia (4.7%, a difference of 0.27%), and Immigrants from Iran (4.6%, a difference of 0.29%).
| Demographics | Rating | Rank | Unemployment Among Ages 45 to 54 years |
| Immigrants | Nigeria | 13.3 /100 | #209 | Poor 4.6% |
| Immigrants | South America | 12.2 /100 | #210 | Poor 4.6% |
| Creek | 11.9 /100 | #211 | Poor 4.6% |
| Immigrants | Iran | 11.5 /100 | #212 | Poor 4.6% |
| Panamanians | 10.7 /100 | #213 | Poor 4.6% |
| Cherokee | 10.6 /100 | #214 | Poor 4.6% |
| Immigrants | Panama | 10.4 /100 | #215 | Poor 4.6% |
| Lumbee | 9.2 /100 | #216 | Tragic 4.6% |
| Immigrants | Cambodia | 7.4 /100 | #217 | Tragic 4.7% |
| Immigrants | Uganda | 7.1 /100 | #218 | Tragic 4.7% |
| Nigerians | 7.0 /100 | #219 | Tragic 4.7% |
| Guamanians/Chamorros | 6.8 /100 | #220 | Tragic 4.7% |
| Choctaw | 6.1 /100 | #221 | Tragic 4.7% |
| Immigrants | Southern Europe | 6.0 /100 | #222 | Tragic 4.7% |
| Potawatomi | 5.7 /100 | #223 | Tragic 4.7% |