Immigrants from Caribbean vs Lumbee Associate's Degree
COMPARE
Immigrants from Caribbean
Lumbee
Associate's Degree
Associate's Degree Comparison
Immigrants from Caribbean
Lumbee
39.7%
ASSOCIATE'S DEGREE
0.0/ 100
METRIC RATING
286th/ 347
METRIC RANK
34.1%
ASSOCIATE'S DEGREE
0.0/ 100
METRIC RATING
337th/ 347
METRIC RANK
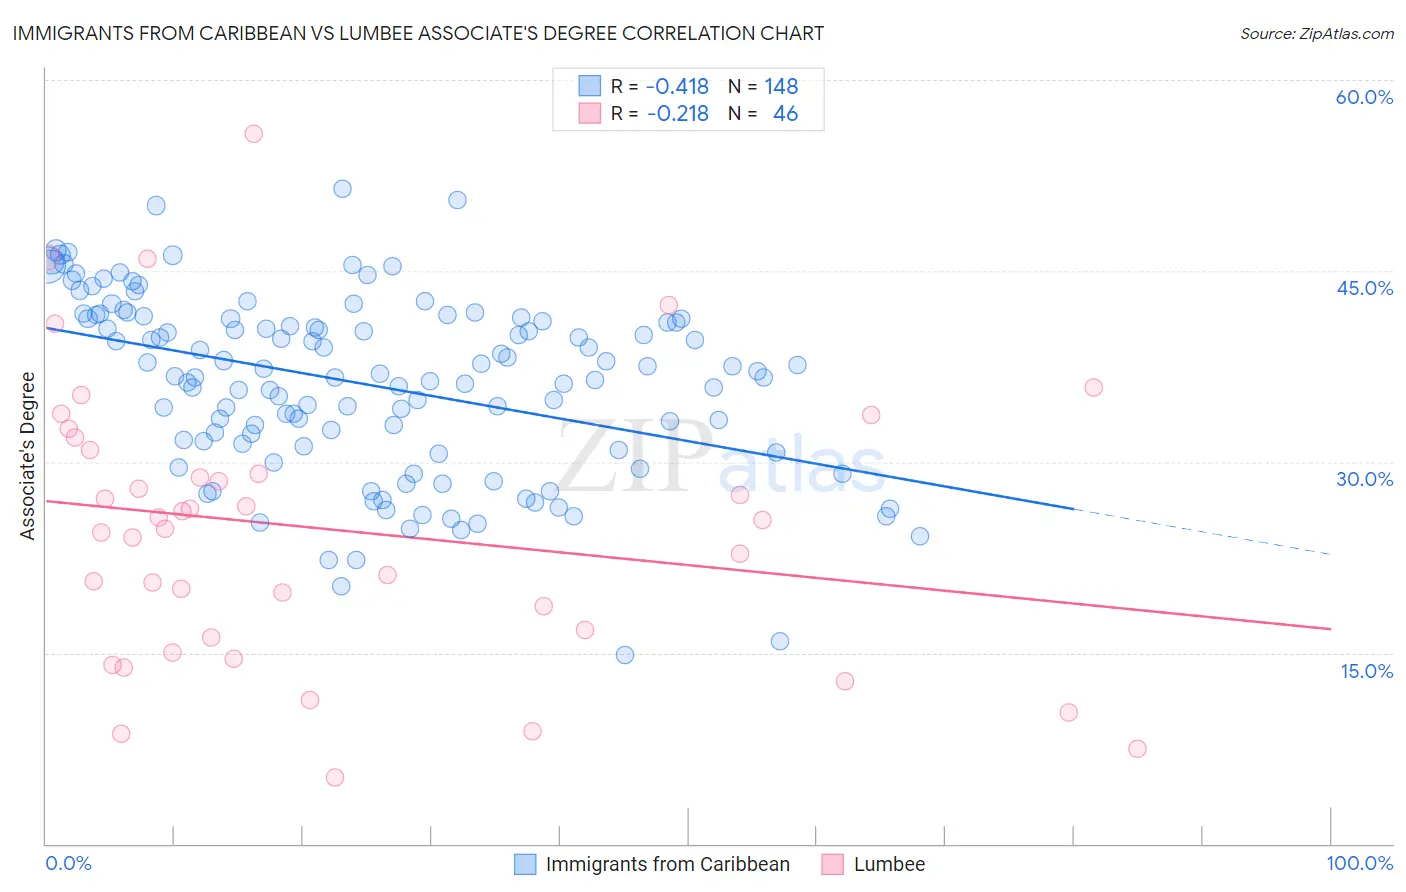
Immigrants from Caribbean vs Lumbee Associate's Degree Correlation Chart
The statistical analysis conducted on geographies consisting of 450,016,404 people shows a moderate negative correlation between the proportion of Immigrants from Caribbean and percentage of population with at least associate's degree education in the United States with a correlation coefficient (R) of -0.418 and weighted average of 39.7%. Similarly, the statistical analysis conducted on geographies consisting of 92,299,068 people shows a weak negative correlation between the proportion of Lumbee and percentage of population with at least associate's degree education in the United States with a correlation coefficient (R) of -0.218 and weighted average of 34.1%, a difference of 16.5%.
Associate's Degree Correlation Summary
| Measurement | Immigrants from Caribbean | Lumbee |
| Minimum | 14.8% | 5.2% |
| Maximum | 51.5% | 55.8% |
| Range | 36.6% | 50.6% |
| Mean | 36.1% | 24.7% |
| Median | 36.8% | 25.1% |
| Interquartile 25% (IQ1) | 31.3% | 16.2% |
| Interquartile 75% (IQ3) | 41.2% | 30.9% |
| Interquartile Range (IQR) | 9.9% | 14.7% |
| Standard Deviation (Sample) | 7.0% | 11.1% |
| Standard Deviation (Population) | 7.0% | 10.9% |
Similar Demographics by Associate's Degree
Demographics Similar to Immigrants from Caribbean by Associate's Degree
In terms of associate's degree, the demographic groups most similar to Immigrants from Caribbean are Aleut (39.6%, a difference of 0.26%), Immigrants from Belize (39.9%, a difference of 0.34%), Comanche (39.9%, a difference of 0.44%), Immigrants from Cuba (39.5%, a difference of 0.50%), and Haitian (40.0%, a difference of 0.55%).
| Demographics | Rating | Rank | Associate's Degree |
| Immigrants | Nicaragua | 0.1 /100 | #279 | Tragic 40.3% |
| Immigrants | Micronesia | 0.1 /100 | #280 | Tragic 40.2% |
| Immigrants | Portugal | 0.1 /100 | #281 | Tragic 40.1% |
| Bangladeshis | 0.1 /100 | #282 | Tragic 40.0% |
| Haitians | 0.1 /100 | #283 | Tragic 40.0% |
| Comanche | 0.1 /100 | #284 | Tragic 39.9% |
| Immigrants | Belize | 0.1 /100 | #285 | Tragic 39.9% |
| Immigrants | Caribbean | 0.0 /100 | #286 | Tragic 39.7% |
| Aleuts | 0.0 /100 | #287 | Tragic 39.6% |
| Immigrants | Cuba | 0.0 /100 | #288 | Tragic 39.5% |
| Central Americans | 0.0 /100 | #289 | Tragic 39.4% |
| Immigrants | Haiti | 0.0 /100 | #290 | Tragic 39.3% |
| Dominicans | 0.0 /100 | #291 | Tragic 39.3% |
| Blacks/African Americans | 0.0 /100 | #292 | Tragic 39.1% |
| Nepalese | 0.0 /100 | #293 | Tragic 39.0% |
Demographics Similar to Lumbee by Associate's Degree
In terms of associate's degree, the demographic groups most similar to Lumbee are Pueblo (34.0%, a difference of 0.41%), Immigrants from Mexico (33.7%, a difference of 1.1%), Hopi (34.6%, a difference of 1.3%), Spanish American Indian (34.9%, a difference of 2.2%), and Native/Alaskan (34.9%, a difference of 2.3%).
| Demographics | Rating | Rank | Associate's Degree |
| Apache | 0.0 /100 | #330 | Tragic 36.2% |
| Immigrants | Azores | 0.0 /100 | #331 | Tragic 35.6% |
| Immigrants | Central America | 0.0 /100 | #332 | Tragic 35.0% |
| Mexicans | 0.0 /100 | #333 | Tragic 35.0% |
| Natives/Alaskans | 0.0 /100 | #334 | Tragic 34.9% |
| Spanish American Indians | 0.0 /100 | #335 | Tragic 34.9% |
| Hopi | 0.0 /100 | #336 | Tragic 34.6% |
| Lumbee | 0.0 /100 | #337 | Tragic 34.1% |
| Pueblo | 0.0 /100 | #338 | Tragic 34.0% |
| Immigrants | Mexico | 0.0 /100 | #339 | Tragic 33.7% |
| Navajo | 0.0 /100 | #340 | Tragic 32.6% |
| Inupiat | 0.0 /100 | #341 | Tragic 32.6% |
| Yakama | 0.0 /100 | #342 | Tragic 32.3% |
| Tohono O'odham | 0.0 /100 | #343 | Tragic 31.8% |
| Yuman | 0.0 /100 | #344 | Tragic 31.3% |