Alaska Native vs Immigrants from Trinidad and Tobago Associate's Degree
COMPARE
Alaska Native
Immigrants from Trinidad and Tobago
Associate's Degree
Associate's Degree Comparison
Alaska Natives
Immigrants from Trinidad and Tobago
37.5%
ASSOCIATE'S DEGREE
0.0/ 100
METRIC RATING
318th/ 347
METRIC RANK
43.3%
ASSOCIATE'S DEGREE
3.0/ 100
METRIC RATING
229th/ 347
METRIC RANK
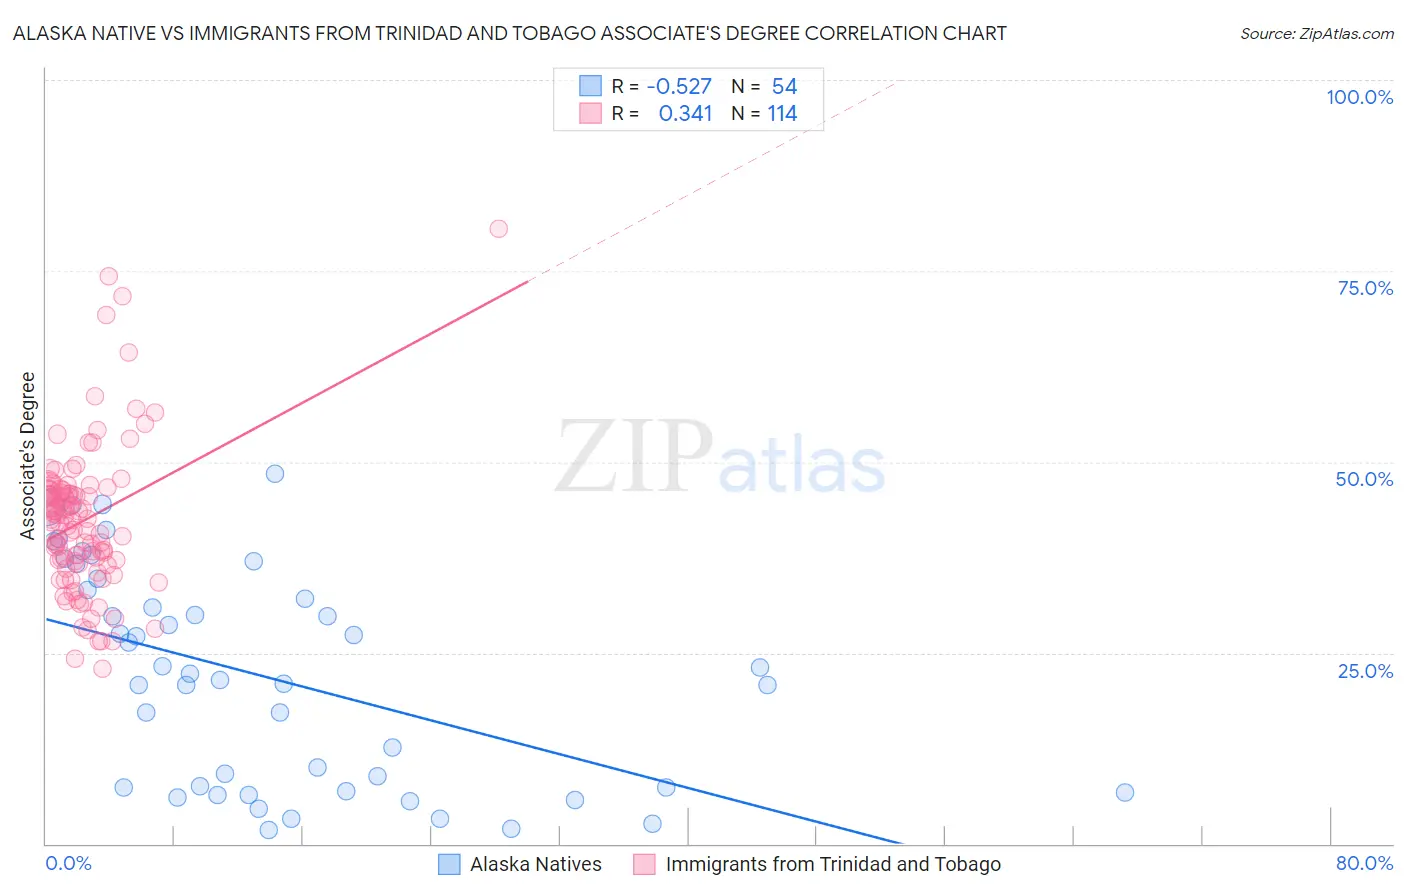
Alaska Native vs Immigrants from Trinidad and Tobago Associate's Degree Correlation Chart
The statistical analysis conducted on geographies consisting of 76,777,220 people shows a substantial negative correlation between the proportion of Alaska Natives and percentage of population with at least associate's degree education in the United States with a correlation coefficient (R) of -0.527 and weighted average of 37.5%. Similarly, the statistical analysis conducted on geographies consisting of 223,520,472 people shows a mild positive correlation between the proportion of Immigrants from Trinidad and Tobago and percentage of population with at least associate's degree education in the United States with a correlation coefficient (R) of 0.341 and weighted average of 43.3%, a difference of 15.7%.
Associate's Degree Correlation Summary
| Measurement | Alaska Native | Immigrants from Trinidad and Tobago |
| Minimum | 1.8% | 23.0% |
| Maximum | 48.5% | 80.5% |
| Range | 46.7% | 57.6% |
| Mean | 21.8% | 42.4% |
| Median | 21.9% | 42.4% |
| Interquartile 25% (IQ1) | 7.3% | 37.0% |
| Interquartile 75% (IQ3) | 33.2% | 46.1% |
| Interquartile Range (IQR) | 25.9% | 9.1% |
| Standard Deviation (Sample) | 14.0% | 9.7% |
| Standard Deviation (Population) | 13.9% | 9.7% |
Similar Demographics by Associate's Degree
Demographics Similar to Alaska Natives by Associate's Degree
In terms of associate's degree, the demographic groups most similar to Alaska Natives are Fijian (37.4%, a difference of 0.22%), Yaqui (37.6%, a difference of 0.23%), Crow (37.6%, a difference of 0.25%), Cajun (37.4%, a difference of 0.25%), and Creek (37.6%, a difference of 0.26%).
| Demographics | Rating | Rank | Associate's Degree |
| Immigrants | Latin America | 0.0 /100 | #311 | Tragic 37.9% |
| Choctaw | 0.0 /100 | #312 | Tragic 37.8% |
| Hispanics or Latinos | 0.0 /100 | #313 | Tragic 37.7% |
| Seminole | 0.0 /100 | #314 | Tragic 37.7% |
| Creek | 0.0 /100 | #315 | Tragic 37.6% |
| Crow | 0.0 /100 | #316 | Tragic 37.6% |
| Yaqui | 0.0 /100 | #317 | Tragic 37.6% |
| Alaska Natives | 0.0 /100 | #318 | Tragic 37.5% |
| Fijians | 0.0 /100 | #319 | Tragic 37.4% |
| Cajuns | 0.0 /100 | #320 | Tragic 37.4% |
| Immigrants | Yemen | 0.0 /100 | #321 | Tragic 37.3% |
| Pennsylvania Germans | 0.0 /100 | #322 | Tragic 37.2% |
| Immigrants | Cabo Verde | 0.0 /100 | #323 | Tragic 36.8% |
| Arapaho | 0.0 /100 | #324 | Tragic 36.7% |
| Menominee | 0.0 /100 | #325 | Tragic 36.7% |
Demographics Similar to Immigrants from Trinidad and Tobago by Associate's Degree
In terms of associate's degree, the demographic groups most similar to Immigrants from Trinidad and Tobago are Immigrants from Barbados (43.3%, a difference of 0.070%), Liberian (43.3%, a difference of 0.080%), Hmong (43.4%, a difference of 0.16%), Native Hawaiian (43.1%, a difference of 0.50%), and Trinidadian and Tobagonian (43.6%, a difference of 0.60%).
| Demographics | Rating | Rank | Associate's Degree |
| Barbadians | 5.8 /100 | #222 | Tragic 43.9% |
| Sub-Saharan Africans | 5.5 /100 | #223 | Tragic 43.9% |
| West Indians | 5.2 /100 | #224 | Tragic 43.8% |
| Guamanians/Chamorros | 4.8 /100 | #225 | Tragic 43.8% |
| Immigrants | Burma/Myanmar | 4.3 /100 | #226 | Tragic 43.7% |
| Trinidadians and Tobagonians | 4.0 /100 | #227 | Tragic 43.6% |
| Hmong | 3.2 /100 | #228 | Tragic 43.4% |
| Immigrants | Trinidad and Tobago | 3.0 /100 | #229 | Tragic 43.3% |
| Immigrants | Barbados | 2.9 /100 | #230 | Tragic 43.3% |
| Liberians | 2.9 /100 | #231 | Tragic 43.3% |
| Native Hawaiians | 2.3 /100 | #232 | Tragic 43.1% |
| Tongans | 2.2 /100 | #233 | Tragic 43.0% |
| Tlingit-Haida | 2.1 /100 | #234 | Tragic 43.0% |
| Ecuadorians | 2.0 /100 | #235 | Tragic 43.0% |
| Immigrants | St. Vincent and the Grenadines | 1.9 /100 | #236 | Tragic 42.9% |