Alaska Native vs Immigrants from Kenya Doctorate Degree
COMPARE
Alaska Native
Immigrants from Kenya
Doctorate Degree
Doctorate Degree Comparison
Alaska Natives
Immigrants from Kenya
1.4%
DOCTORATE DEGREE
0.3/ 100
METRIC RATING
292nd/ 347
METRIC RANK
1.9%
DOCTORATE DEGREE
74.3/ 100
METRIC RATING
152nd/ 347
METRIC RANK
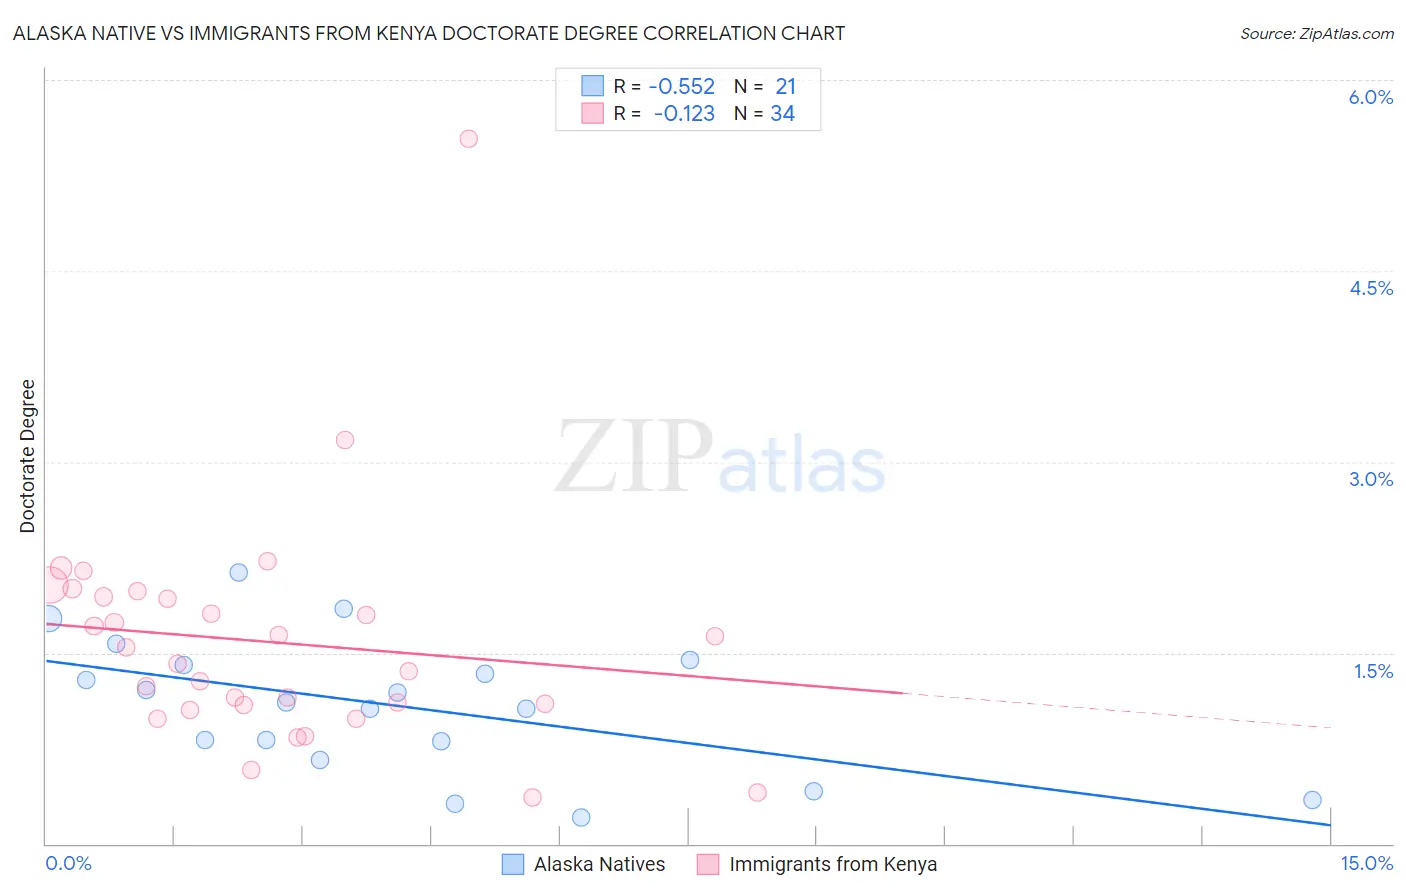
Alaska Native vs Immigrants from Kenya Doctorate Degree Correlation Chart
The statistical analysis conducted on geographies consisting of 76,370,977 people shows a substantial negative correlation between the proportion of Alaska Natives and percentage of population with at least doctorate degree education in the United States with a correlation coefficient (R) of -0.552 and weighted average of 1.4%. Similarly, the statistical analysis conducted on geographies consisting of 217,428,476 people shows a poor negative correlation between the proportion of Immigrants from Kenya and percentage of population with at least doctorate degree education in the United States with a correlation coefficient (R) of -0.123 and weighted average of 1.9%, a difference of 32.7%.
Doctorate Degree Correlation Summary
| Measurement | Alaska Native | Immigrants from Kenya |
| Minimum | 0.21% | 0.36% |
| Maximum | 2.1% | 5.5% |
| Range | 1.9% | 5.2% |
| Mean | 1.1% | 1.6% |
| Median | 1.1% | 1.5% |
| Interquartile 25% (IQ1) | 0.73% | 1.1% |
| Interquartile 75% (IQ3) | 1.4% | 1.9% |
| Interquartile Range (IQR) | 0.69% | 0.85% |
| Standard Deviation (Sample) | 0.53% | 0.91% |
| Standard Deviation (Population) | 0.51% | 0.90% |
Similar Demographics by Doctorate Degree
Demographics Similar to Alaska Natives by Doctorate Degree
In terms of doctorate degree, the demographic groups most similar to Alaska Natives are Black/African American (1.4%, a difference of 0.17%), Choctaw (1.4%, a difference of 0.40%), Cape Verdean (1.4%, a difference of 0.42%), Immigrants from El Salvador (1.4%, a difference of 0.55%), and Immigrants from Yemen (1.4%, a difference of 0.59%).
| Demographics | Rating | Rank | Doctorate Degree |
| Malaysians | 0.3 /100 | #285 | Tragic 1.5% |
| Cherokee | 0.3 /100 | #286 | Tragic 1.5% |
| Cajuns | 0.3 /100 | #287 | Tragic 1.5% |
| Immigrants | El Salvador | 0.3 /100 | #288 | Tragic 1.4% |
| Cape Verdeans | 0.3 /100 | #289 | Tragic 1.4% |
| Choctaw | 0.3 /100 | #290 | Tragic 1.4% |
| Blacks/African Americans | 0.3 /100 | #291 | Tragic 1.4% |
| Alaska Natives | 0.3 /100 | #292 | Tragic 1.4% |
| Immigrants | Yemen | 0.2 /100 | #293 | Tragic 1.4% |
| Samoans | 0.2 /100 | #294 | Tragic 1.4% |
| Guatemalans | 0.2 /100 | #295 | Tragic 1.4% |
| Immigrants | Ecuador | 0.2 /100 | #296 | Tragic 1.4% |
| Tsimshian | 0.2 /100 | #297 | Tragic 1.4% |
| Puerto Ricans | 0.1 /100 | #298 | Tragic 1.4% |
| Belizeans | 0.1 /100 | #299 | Tragic 1.4% |
Demographics Similar to Immigrants from Kenya by Doctorate Degree
In terms of doctorate degree, the demographic groups most similar to Immigrants from Kenya are Immigrants from Oceania (1.9%, a difference of 0.050%), Albanian (1.9%, a difference of 0.10%), Immigrants from Albania (1.9%, a difference of 0.27%), Polish (1.9%, a difference of 0.29%), and English (1.9%, a difference of 0.30%).
| Demographics | Rating | Rank | Doctorate Degree |
| Kenyans | 83.6 /100 | #145 | Excellent 1.9% |
| Immigrants | Syria | 83.6 /100 | #146 | Excellent 1.9% |
| Immigrants | Senegal | 82.5 /100 | #147 | Excellent 1.9% |
| Luxembourgers | 81.1 /100 | #148 | Excellent 1.9% |
| Basques | 76.9 /100 | #149 | Good 1.9% |
| English | 75.9 /100 | #150 | Good 1.9% |
| Albanians | 74.8 /100 | #151 | Good 1.9% |
| Immigrants | Kenya | 74.3 /100 | #152 | Good 1.9% |
| Immigrants | Oceania | 74.0 /100 | #153 | Good 1.9% |
| Immigrants | Albania | 72.8 /100 | #154 | Good 1.9% |
| Poles | 72.7 /100 | #155 | Good 1.9% |
| Slavs | 72.4 /100 | #156 | Good 1.9% |
| Danes | 71.9 /100 | #157 | Good 1.9% |
| Hungarians | 71.7 /100 | #158 | Good 1.9% |
| Slovenes | 70.2 /100 | #159 | Good 1.9% |