Alaska Native vs Immigrants from Kenya Unemployment Among Youth under 25 years
COMPARE
Alaska Native
Immigrants from Kenya
Unemployment Among Youth under 25 years
Unemployment Among Youth under 25 years Comparison
Alaska Natives
Immigrants from Kenya
14.9%
UNEMPLOYMENT AMONG YOUTH UNDER 25 YEARS
0.0/ 100
METRIC RATING
325th/ 347
METRIC RANK
11.2%
UNEMPLOYMENT AMONG YOUTH UNDER 25 YEARS
97.6/ 100
METRIC RATING
68th/ 347
METRIC RANK
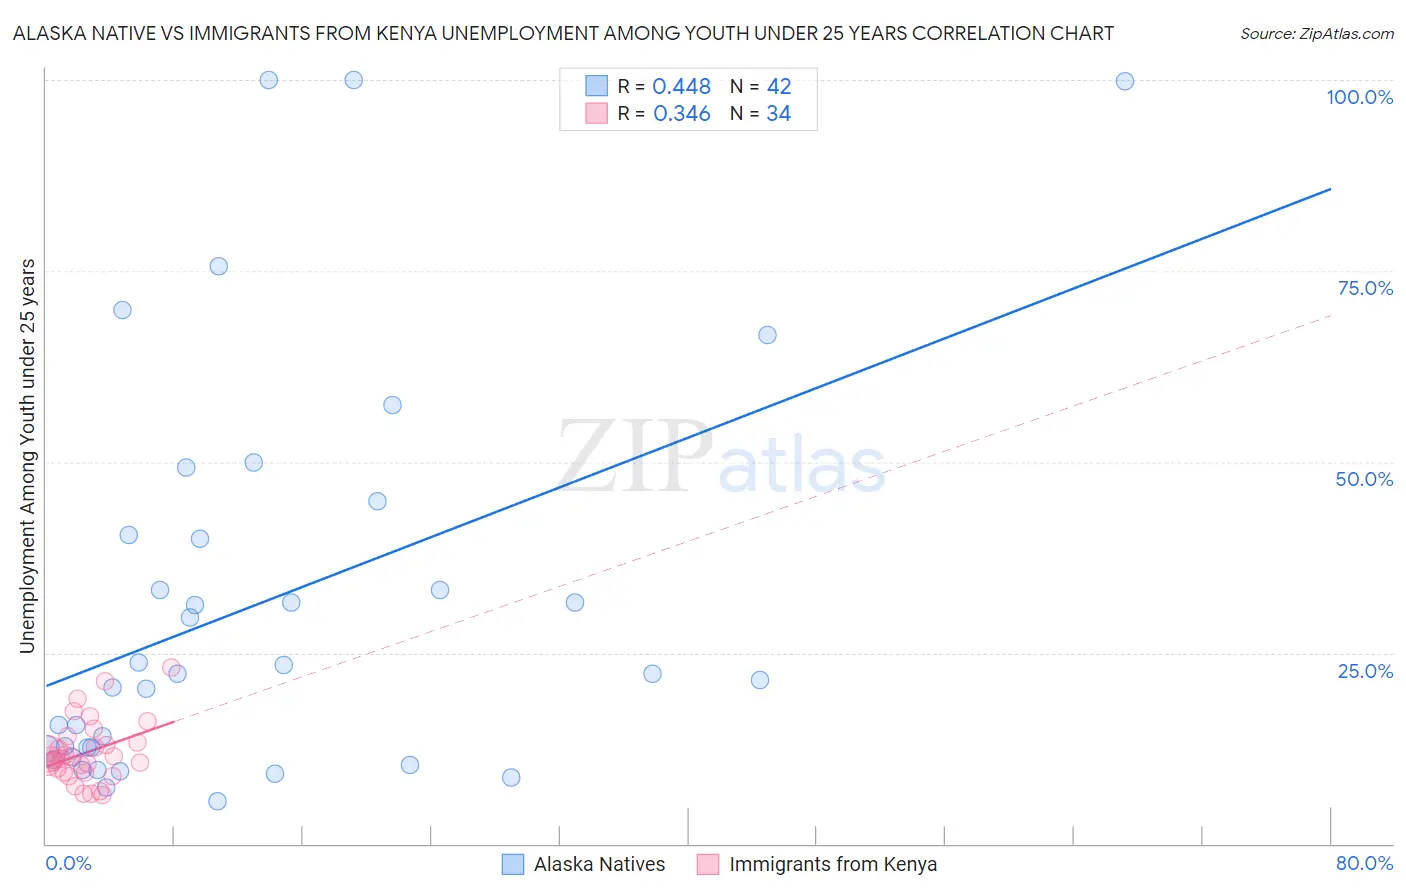
Alaska Native vs Immigrants from Kenya Unemployment Among Youth under 25 years Correlation Chart
The statistical analysis conducted on geographies consisting of 76,575,345 people shows a moderate positive correlation between the proportion of Alaska Natives and unemployment rate among youth under the age of 25 in the United States with a correlation coefficient (R) of 0.448 and weighted average of 14.9%. Similarly, the statistical analysis conducted on geographies consisting of 217,150,374 people shows a mild positive correlation between the proportion of Immigrants from Kenya and unemployment rate among youth under the age of 25 in the United States with a correlation coefficient (R) of 0.346 and weighted average of 11.2%, a difference of 33.6%.
Unemployment Among Youth under 25 years Correlation Summary
| Measurement | Alaska Native | Immigrants from Kenya |
| Minimum | 5.6% | 6.4% |
| Maximum | 100.0% | 23.0% |
| Range | 94.4% | 16.6% |
| Mean | 31.6% | 11.9% |
| Median | 22.2% | 11.3% |
| Interquartile 25% (IQ1) | 12.5% | 9.4% |
| Interquartile 75% (IQ3) | 40.4% | 13.3% |
| Interquartile Range (IQR) | 28.0% | 3.9% |
| Standard Deviation (Sample) | 26.3% | 4.0% |
| Standard Deviation (Population) | 25.9% | 3.9% |
Similar Demographics by Unemployment Among Youth under 25 years
Demographics Similar to Alaska Natives by Unemployment Among Youth under 25 years
In terms of unemployment among youth under 25 years, the demographic groups most similar to Alaska Natives are Immigrants from Jamaica (14.8%, a difference of 0.67%), Immigrants from Trinidad and Tobago (14.6%, a difference of 1.8%), Trinidadian and Tobagonian (14.6%, a difference of 1.9%), Cheyenne (14.6%, a difference of 2.0%), and Barbadian (14.6%, a difference of 2.2%).
| Demographics | Rating | Rank | Unemployment Among Youth under 25 years |
| Immigrants | Dominica | 0.0 /100 | #318 | Tragic 14.6% |
| West Indians | 0.0 /100 | #319 | Tragic 14.6% |
| Barbadians | 0.0 /100 | #320 | Tragic 14.6% |
| Cheyenne | 0.0 /100 | #321 | Tragic 14.6% |
| Trinidadians and Tobagonians | 0.0 /100 | #322 | Tragic 14.6% |
| Immigrants | Trinidad and Tobago | 0.0 /100 | #323 | Tragic 14.6% |
| Immigrants | Jamaica | 0.0 /100 | #324 | Tragic 14.8% |
| Alaska Natives | 0.0 /100 | #325 | Tragic 14.9% |
| Immigrants | Barbados | 0.0 /100 | #326 | Tragic 15.2% |
| British West Indians | 0.0 /100 | #327 | Tragic 15.5% |
| Immigrants | Dominican Republic | 0.0 /100 | #328 | Tragic 15.6% |
| Immigrants | Yemen | 0.0 /100 | #329 | Tragic 15.6% |
| Yakama | 0.0 /100 | #330 | Tragic 15.6% |
| Dominicans | 0.0 /100 | #331 | Tragic 15.7% |
| Immigrants | Grenada | 0.0 /100 | #332 | Tragic 15.8% |
Demographics Similar to Immigrants from Kenya by Unemployment Among Youth under 25 years
In terms of unemployment among youth under 25 years, the demographic groups most similar to Immigrants from Kenya are Chickasaw (11.2%, a difference of 0.020%), Macedonian (11.2%, a difference of 0.040%), Immigrants from Moldova (11.2%, a difference of 0.050%), Slavic (11.2%, a difference of 0.050%), and Immigrants from Singapore (11.2%, a difference of 0.070%).
| Demographics | Rating | Rank | Unemployment Among Youth under 25 years |
| Filipinos | 98.3 /100 | #61 | Exceptional 11.1% |
| Immigrants | Netherlands | 98.1 /100 | #62 | Exceptional 11.1% |
| Immigrants | Croatia | 98.1 /100 | #63 | Exceptional 11.1% |
| Jordanians | 97.9 /100 | #64 | Exceptional 11.1% |
| Immigrants | Singapore | 97.8 /100 | #65 | Exceptional 11.2% |
| Macedonians | 97.7 /100 | #66 | Exceptional 11.2% |
| Chickasaw | 97.7 /100 | #67 | Exceptional 11.2% |
| Immigrants | Kenya | 97.6 /100 | #68 | Exceptional 11.2% |
| Immigrants | Moldova | 97.5 /100 | #69 | Exceptional 11.2% |
| Slavs | 97.5 /100 | #70 | Exceptional 11.2% |
| Bhutanese | 97.4 /100 | #71 | Exceptional 11.2% |
| Immigrants | Australia | 97.3 /100 | #72 | Exceptional 11.2% |
| Creek | 97.2 /100 | #73 | Exceptional 11.2% |
| New Zealanders | 97.2 /100 | #74 | Exceptional 11.2% |
| French | 97.1 /100 | #75 | Exceptional 11.2% |