Alsatian vs Immigrants from Kenya Associate's Degree
COMPARE
Alsatian
Immigrants from Kenya
Associate's Degree
Associate's Degree Comparison
Alsatians
Immigrants from Kenya
48.8%
ASSOCIATE'S DEGREE
94.6/ 100
METRIC RATING
120th/ 347
METRIC RANK
47.2%
ASSOCIATE'S DEGREE
72.1/ 100
METRIC RATING
154th/ 347
METRIC RANK
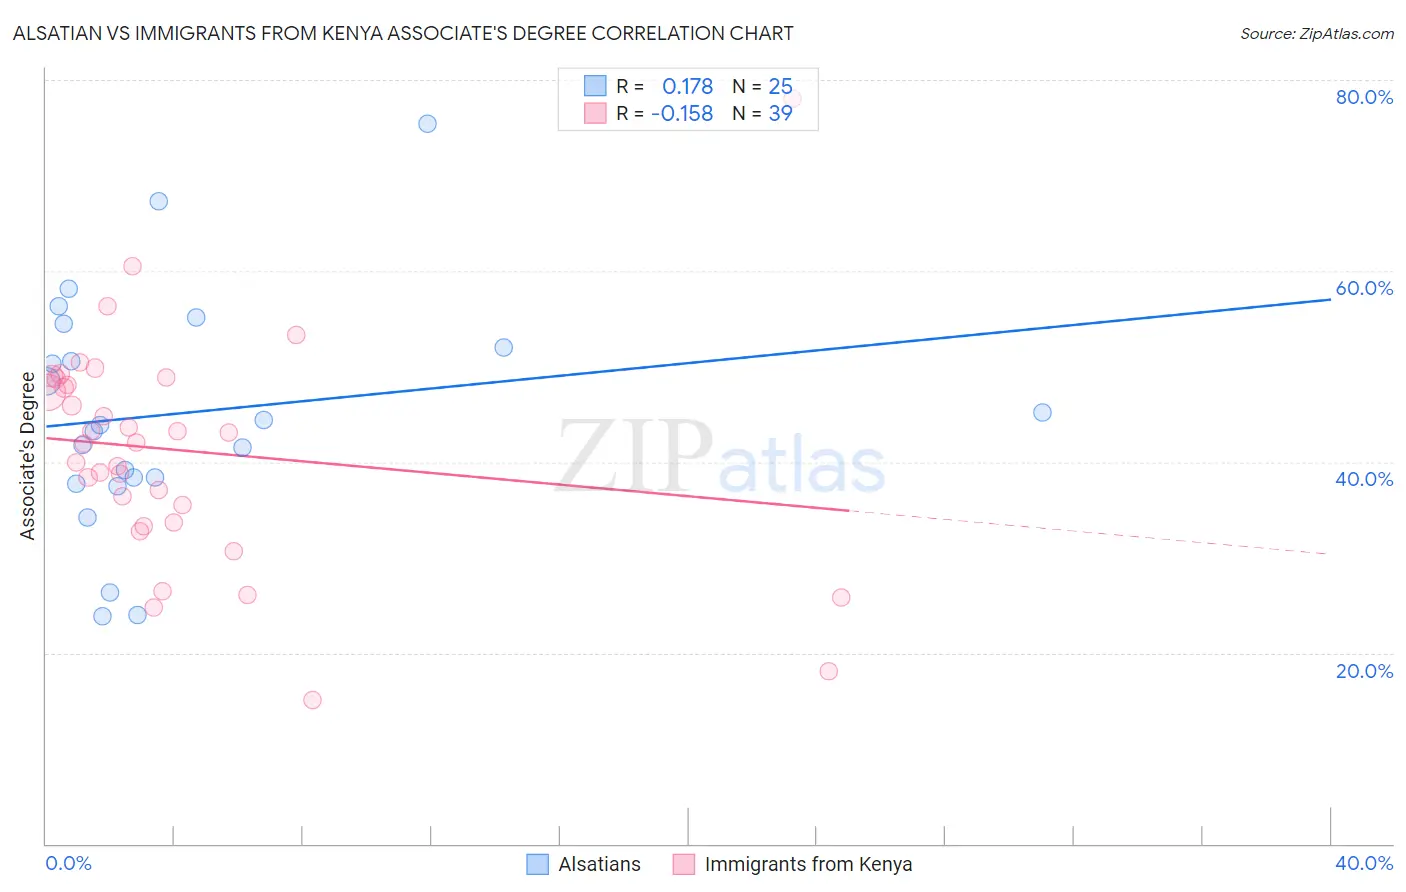
Alsatian vs Immigrants from Kenya Associate's Degree Correlation Chart
The statistical analysis conducted on geographies consisting of 82,682,365 people shows a poor positive correlation between the proportion of Alsatians and percentage of population with at least associate's degree education in the United States with a correlation coefficient (R) of 0.178 and weighted average of 48.8%. Similarly, the statistical analysis conducted on geographies consisting of 218,082,040 people shows a poor negative correlation between the proportion of Immigrants from Kenya and percentage of population with at least associate's degree education in the United States with a correlation coefficient (R) of -0.158 and weighted average of 47.2%, a difference of 3.5%.
Associate's Degree Correlation Summary
| Measurement | Alsatian | Immigrants from Kenya |
| Minimum | 23.9% | 15.0% |
| Maximum | 75.4% | 78.0% |
| Range | 51.6% | 63.0% |
| Mean | 45.1% | 41.2% |
| Median | 43.9% | 42.0% |
| Interquartile 25% (IQ1) | 38.0% | 33.7% |
| Interquartile 75% (IQ3) | 53.2% | 48.8% |
| Interquartile Range (IQR) | 15.2% | 15.1% |
| Standard Deviation (Sample) | 12.3% | 11.8% |
| Standard Deviation (Population) | 12.1% | 11.6% |
Similar Demographics by Associate's Degree
Demographics Similar to Alsatians by Associate's Degree
In terms of associate's degree, the demographic groups most similar to Alsatians are Lebanese (48.8%, a difference of 0.020%), Albanian (48.8%, a difference of 0.030%), Afghan (48.9%, a difference of 0.10%), British (48.9%, a difference of 0.14%), and Luxembourger (48.9%, a difference of 0.20%).
| Demographics | Rating | Rank | Associate's Degree |
| Palestinians | 95.3 /100 | #113 | Exceptional 49.0% |
| Arabs | 95.3 /100 | #114 | Exceptional 49.0% |
| Luxembourgers | 95.1 /100 | #115 | Exceptional 48.9% |
| British | 95.0 /100 | #116 | Exceptional 48.9% |
| Afghans | 94.8 /100 | #117 | Exceptional 48.9% |
| Albanians | 94.7 /100 | #118 | Exceptional 48.8% |
| Lebanese | 94.6 /100 | #119 | Exceptional 48.8% |
| Alsatians | 94.6 /100 | #120 | Exceptional 48.8% |
| Ugandans | 93.9 /100 | #121 | Exceptional 48.7% |
| Italians | 93.9 /100 | #122 | Exceptional 48.7% |
| Brazilians | 93.7 /100 | #123 | Exceptional 48.7% |
| Serbians | 92.6 /100 | #124 | Exceptional 48.5% |
| Chinese | 92.5 /100 | #125 | Exceptional 48.5% |
| Immigrants | Syria | 92.2 /100 | #126 | Exceptional 48.5% |
| Immigrants | Uganda | 92.1 /100 | #127 | Exceptional 48.5% |
Demographics Similar to Immigrants from Kenya by Associate's Degree
In terms of associate's degree, the demographic groups most similar to Immigrants from Kenya are Czech (47.2%, a difference of 0.010%), Kenyan (47.1%, a difference of 0.13%), South American (47.1%, a difference of 0.14%), Sudanese (47.1%, a difference of 0.16%), and Immigrants from Afghanistan (47.3%, a difference of 0.20%).
| Demographics | Rating | Rank | Associate's Degree |
| Danes | 77.3 /100 | #147 | Good 47.4% |
| South American Indians | 76.7 /100 | #148 | Good 47.4% |
| Immigrants | Armenia | 76.6 /100 | #149 | Good 47.4% |
| Iraqis | 76.2 /100 | #150 | Good 47.4% |
| Immigrants | North Macedonia | 76.0 /100 | #151 | Good 47.4% |
| Immigrants | Afghanistan | 74.3 /100 | #152 | Good 47.3% |
| Czechs | 72.2 /100 | #153 | Good 47.2% |
| Immigrants | Kenya | 72.1 /100 | #154 | Good 47.2% |
| Kenyans | 70.6 /100 | #155 | Good 47.1% |
| South Americans | 70.5 /100 | #156 | Good 47.1% |
| Sudanese | 70.3 /100 | #157 | Good 47.1% |
| Immigrants | Germany | 69.7 /100 | #158 | Good 47.1% |
| Immigrants | Poland | 69.2 /100 | #159 | Good 47.1% |
| Scottish | 65.4 /100 | #160 | Good 46.9% |
| Scandinavians | 65.2 /100 | #161 | Good 46.9% |