Czechoslovakian vs Immigrants from Kenya Associate's Degree
COMPARE
Czechoslovakian
Immigrants from Kenya
Associate's Degree
Associate's Degree Comparison
Czechoslovakians
Immigrants from Kenya
46.0%
ASSOCIATE'S DEGREE
40.0/ 100
METRIC RATING
184th/ 347
METRIC RANK
47.2%
ASSOCIATE'S DEGREE
72.1/ 100
METRIC RATING
154th/ 347
METRIC RANK
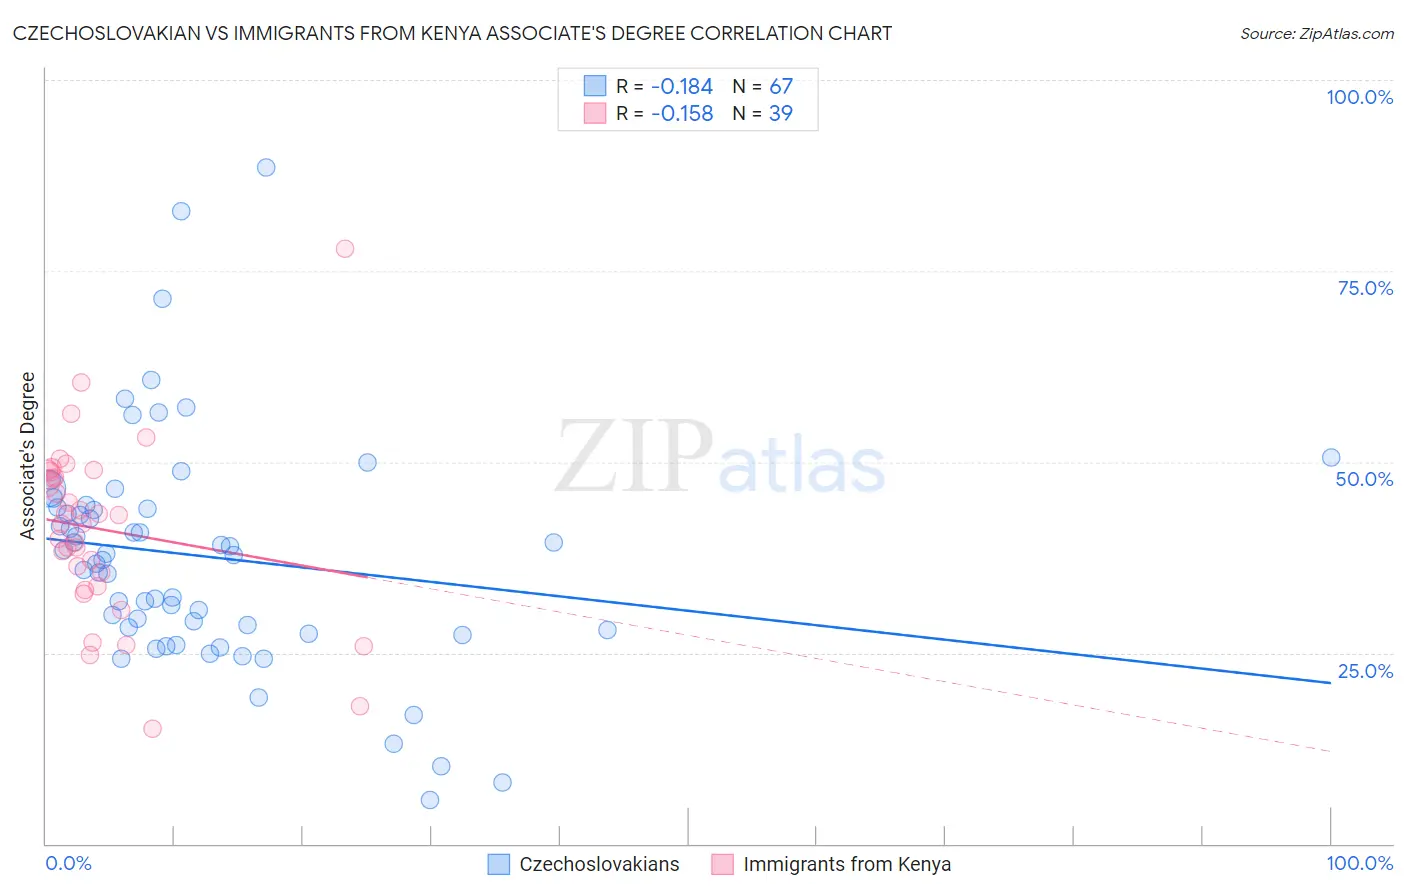
Czechoslovakian vs Immigrants from Kenya Associate's Degree Correlation Chart
The statistical analysis conducted on geographies consisting of 368,660,591 people shows a poor negative correlation between the proportion of Czechoslovakians and percentage of population with at least associate's degree education in the United States with a correlation coefficient (R) of -0.184 and weighted average of 46.0%. Similarly, the statistical analysis conducted on geographies consisting of 218,082,040 people shows a poor negative correlation between the proportion of Immigrants from Kenya and percentage of population with at least associate's degree education in the United States with a correlation coefficient (R) of -0.158 and weighted average of 47.2%, a difference of 2.5%.
Associate's Degree Correlation Summary
| Measurement | Czechoslovakian | Immigrants from Kenya |
| Minimum | 5.7% | 15.0% |
| Maximum | 88.6% | 78.0% |
| Range | 82.8% | 63.0% |
| Mean | 37.6% | 41.2% |
| Median | 37.8% | 42.0% |
| Interquartile 25% (IQ1) | 28.0% | 33.7% |
| Interquartile 75% (IQ3) | 44.1% | 48.8% |
| Interquartile Range (IQR) | 16.1% | 15.1% |
| Standard Deviation (Sample) | 15.1% | 11.8% |
| Standard Deviation (Population) | 15.0% | 11.6% |
Similar Demographics by Associate's Degree
Demographics Similar to Czechoslovakians by Associate's Degree
In terms of associate's degree, the demographic groups most similar to Czechoslovakians are Yugoslavian (46.0%, a difference of 0.020%), Swiss (46.0%, a difference of 0.030%), Immigrants from Colombia (46.0%, a difference of 0.10%), Costa Rican (46.0%, a difference of 0.11%), and Welsh (45.9%, a difference of 0.17%).
| Demographics | Rating | Rank | Associate's Degree |
| Slovaks | 48.4 /100 | #177 | Average 46.3% |
| Immigrants | Bosnia and Herzegovina | 48.3 /100 | #178 | Average 46.3% |
| Sri Lankans | 47.6 /100 | #179 | Average 46.3% |
| Bermudans | 46.4 /100 | #180 | Average 46.2% |
| Immigrants | Colombia | 41.3 /100 | #181 | Average 46.0% |
| Swiss | 40.4 /100 | #182 | Average 46.0% |
| Yugoslavians | 40.2 /100 | #183 | Average 46.0% |
| Czechoslovakians | 40.0 /100 | #184 | Average 46.0% |
| Costa Ricans | 38.6 /100 | #185 | Fair 46.0% |
| Welsh | 37.9 /100 | #186 | Fair 45.9% |
| Immigrants | Uruguay | 35.5 /100 | #187 | Fair 45.8% |
| Ghanaians | 35.5 /100 | #188 | Fair 45.8% |
| Immigrants | Oceania | 34.7 /100 | #189 | Fair 45.8% |
| Vietnamese | 34.0 /100 | #190 | Fair 45.8% |
| Koreans | 33.8 /100 | #191 | Fair 45.8% |
Demographics Similar to Immigrants from Kenya by Associate's Degree
In terms of associate's degree, the demographic groups most similar to Immigrants from Kenya are Czech (47.2%, a difference of 0.010%), Kenyan (47.1%, a difference of 0.13%), South American (47.1%, a difference of 0.14%), Sudanese (47.1%, a difference of 0.16%), and Immigrants from Afghanistan (47.3%, a difference of 0.20%).
| Demographics | Rating | Rank | Associate's Degree |
| Danes | 77.3 /100 | #147 | Good 47.4% |
| South American Indians | 76.7 /100 | #148 | Good 47.4% |
| Immigrants | Armenia | 76.6 /100 | #149 | Good 47.4% |
| Iraqis | 76.2 /100 | #150 | Good 47.4% |
| Immigrants | North Macedonia | 76.0 /100 | #151 | Good 47.4% |
| Immigrants | Afghanistan | 74.3 /100 | #152 | Good 47.3% |
| Czechs | 72.2 /100 | #153 | Good 47.2% |
| Immigrants | Kenya | 72.1 /100 | #154 | Good 47.2% |
| Kenyans | 70.6 /100 | #155 | Good 47.1% |
| South Americans | 70.5 /100 | #156 | Good 47.1% |
| Sudanese | 70.3 /100 | #157 | Good 47.1% |
| Immigrants | Germany | 69.7 /100 | #158 | Good 47.1% |
| Immigrants | Poland | 69.2 /100 | #159 | Good 47.1% |
| Scottish | 65.4 /100 | #160 | Good 46.9% |
| Scandinavians | 65.2 /100 | #161 | Good 46.9% |