Alaska Native vs Assyrian/Chaldean/Syriac In Labor Force | Age 35-44

COMPARE

Alaska Native
Race
Ancestry
AfghanAfricanAlaska NativeAlaskan AthabascanAlbanianAleutAlsatianAmericanApacheArabArapahoArgentineanArmenianAustralianAustrianBahamianBangladeshiBarbadianBasqueBelgianBelizeanBermudanBhutaneseBlackfeetBolivianBrazilianBritishBritish West IndianBulgarianBurmeseCajunCambodianCanadianCape VerdeanCarpatho RusynCelticCentral AmericanCentral American IndianCherokeeCheyenneChickasawChileanChineseChippewaChoctawColombianColvilleComancheCosta RicanCreeCreekCroatianCrowCubanCypriotCzechCzechoslovakianDanishDelawareDominicanDutchDutch West IndianEastern EuropeanEcuadorianEgyptianEnglishEstonianEthiopianEuropeanFijianFilipinoFinnishFrenchFrench American IndianFrench CanadianGermanGerman RussianGhanaianGreekGuamanian/ChamorroGuatemalanGuyaneseHaitianHmongHonduranHopiHoumaHungarianIcelanderIndian (Asian)IndonesianInupiatIranianIraqiIrishIroquoisIsraeliItalianJamaicanJapaneseJordanianKenyanKiowaKoreanLaotianLatvianLebaneseLiberianLithuanianLumbeeLuxembourgerMacedonianMalaysianMalteseMarshalleseMenomineeMexicanMexican American IndianMongolianMoroccanNative HawaiianNavajoNepaleseNew ZealanderNicaraguanNigerianNorthern EuropeanNorwegianOkinawanOsageOttawaPaiutePakistaniPalestinianPanamanianParaguayanPennsylvania GermanPeruvianPimaPolishPortuguesePotawatomiPuebloPuerto RicanPuget Sound SalishRomanianRussianSalvadoranSamoanScandinavianScotch-IrishScottishSeminoleSenegaleseSerbianShoshoneSierra LeoneanSiouxSlavicSlovakSloveneSomaliSouth AfricanSouth AmericanSouth American IndianSoviet UnionSpaniardSpanishSpanish AmericanSpanish American IndianSri LankanSubsaharan AfricanSudaneseSwedishSwissSyrianTaiwaneseThaiTlingit-HaidaTohono O'OdhamTonganTrinidadian and TobagonianTsimshianTurkishU.S. Virgin IslanderUgandanUkrainianUruguayanUteVenezuelanVietnameseWelshWest IndianYakamaYaquiYugoslavianYumanYup'ikZimbabwean
Immigration
NonimmigrantsImmigrantsAfghanistanAfricaAlbaniaArgentinaArmeniaAsiaAustraliaAustriaBahamasBangladeshBarbadosBelarusBelgiumBelizeBoliviaBosnia and HerzegovinaBrazilBulgariaBurma/MyanmarCabo VerdeCambodiaCameroonCanadaCaribbeanCentral AmericaChileChinaColombiaCongoCosta RicaCroatiaCubaCzechoslovakiaDenmarkDominicaDominican RepublicEastern AfricaEastern AsiaEastern EuropeEcuadorEgyptEl SalvadorEnglandEritreaEthiopiaEuropeFijiFranceGermanyGhanaGreeceGrenadaGuatemalaGuyanaHaitiHondurasHong KongHungaryIndiaIndonesiaIranIraqIrelandIsraelItalyJamaicaJapanJordanKazakhstanKenyaKoreaKuwaitLaosLatin AmericaLatviaLebanonLiberiaLithuaniaMalaysiaMexicoMicronesiaMiddle AfricaMoldovaMoroccoNepalNetherlandsNicaraguaNigeriaNorth AmericaNorth MacedoniaNorthern AfricaNorthern EuropeNorwayOceaniaPakistanPanamaPeruPhilippinesPolandPortugalRomaniaRussiaSaudi ArabiaScotlandSenegalSerbiaSierra LeoneSingaporeSomaliaSouth AfricaSouth AmericaSouth Central AsiaSouth Eastern AsiaSouthern EuropeSpainSri LankaSt. Vincent and the GrenadinesSudanSwedenSwitzerlandSyriaTaiwanThailandTrinidad and TobagoTurkeyUgandaUkraineUruguayUzbekistanVenezuelaVietnamWest IndiesWestern AfricaWestern AsiaWestern EuropeYemenZaireZimbabweAzores
Assyrian/Chaldean/Syriac
Race
Ancestry
AfghanAfricanAlaskan AthabascanAlbanianAleutAlsatianAmericanApacheArabArapahoArgentineanArmenianAssyrian/Chaldean/SyriacAustralianAustrianBahamianBangladeshiBarbadianBasqueBelgianBelizeanBermudanBhutaneseBlackfeetBolivianBrazilianBritishBritish West IndianBulgarianBurmeseCajunCambodianCanadianCape VerdeanCarpatho RusynCelticCentral AmericanCentral American IndianCherokeeCheyenneChickasawChileanChineseChippewaChoctawColombianColvilleComancheCosta RicanCreeCreekCroatianCrowCubanCypriotCzechCzechoslovakianDanishDelawareDominicanDutchDutch West IndianEastern EuropeanEcuadorianEgyptianEnglishEstonianEthiopianEuropeanFijianFilipinoFinnishFrenchFrench American IndianFrench CanadianGermanGerman RussianGhanaianGreekGuamanian/ChamorroGuatemalanGuyaneseHaitianHmongHonduranHopiHoumaHungarianIcelanderIndian (Asian)IndonesianInupiatIranianIraqiIrishIroquoisIsraeliItalianJamaicanJapaneseJordanianKenyanKiowaKoreanLaotianLatvianLebaneseLiberianLithuanianLumbeeLuxembourgerMacedonianMalaysianMalteseMarshalleseMenomineeMexicanMexican American IndianMongolianMoroccanNative HawaiianNavajoNepaleseNew ZealanderNicaraguanNigerianNorthern EuropeanNorwegianOkinawanOsageOttawaPaiutePakistaniPalestinianPanamanianParaguayanPennsylvania GermanPeruvianPimaPolishPortuguesePotawatomiPuebloPuerto RicanPuget Sound SalishRomanianRussianSalvadoranSamoanScandinavianScotch-IrishScottishSeminoleSenegaleseSerbianShoshoneSierra LeoneanSiouxSlavicSlovakSloveneSomaliSouth AfricanSouth AmericanSouth American IndianSoviet UnionSpaniardSpanishSpanish AmericanSpanish American IndianSri LankanSubsaharan AfricanSudaneseSwedishSwissSyrianTaiwaneseThaiTlingit-HaidaTohono O'OdhamTonganTrinidadian and TobagonianTsimshianTurkishU.S. Virgin IslanderUgandanUkrainianUruguayanUteVenezuelanVietnameseWelshWest IndianYakamaYaquiYugoslavianYumanYup'ikZimbabwean
Immigration
NonimmigrantsImmigrantsAfghanistanAfricaAlbaniaArgentinaArmeniaAsiaAustraliaAustriaBahamasBangladeshBarbadosBelarusBelgiumBelizeBoliviaBosnia and HerzegovinaBrazilBulgariaBurma/MyanmarCabo VerdeCambodiaCameroonCanadaCaribbeanCentral AmericaChileChinaColombiaCongoCosta RicaCroatiaCubaCzechoslovakiaDenmarkDominicaDominican RepublicEastern AfricaEastern AsiaEastern EuropeEcuadorEgyptEl SalvadorEnglandEritreaEthiopiaEuropeFijiFranceGermanyGhanaGreeceGrenadaGuatemalaGuyanaHaitiHondurasHong KongHungaryIndiaIndonesiaIranIraqIrelandIsraelItalyJamaicaJapanJordanKazakhstanKenyaKoreaKuwaitLaosLatin AmericaLatviaLebanonLiberiaLithuaniaMalaysiaMexicoMicronesiaMiddle AfricaMoldovaMoroccoNepalNetherlandsNicaraguaNigeriaNorth AmericaNorth MacedoniaNorthern AfricaNorthern EuropeNorwayOceaniaPakistanPanamaPeruPhilippinesPolandPortugalRomaniaRussiaSaudi ArabiaScotlandSenegalSerbiaSierra LeoneSingaporeSomaliaSouth AfricaSouth AmericaSouth Central AsiaSouth Eastern AsiaSouthern EuropeSpainSri LankaSt. Vincent and the GrenadinesSudanSwedenSwitzerlandSyriaTaiwanThailandTrinidad and TobagoTurkeyUgandaUkraineUruguayUzbekistanVenezuelaVietnamWest IndiesWestern AfricaWestern AsiaWestern EuropeYemenZaireZimbabweAzores
In Labor Force | Age 35-44
Income
Poverty
Unemployment
Labor Participation
Family Structure
Vehicle Availability
Education Level
Disability

In Labor Force | Age 35-44 Comparison

Alaska Natives

Assyrians/Chaldeans/Syriacs

Tragic
Tragic
81.6%
IN LABOR FORCE | AGE 35-44
0.0/ 100
METRIC RATING
312th/ 347
METRIC RANK
84.0%
IN LABOR FORCE | AGE 35-44
6.6/ 100
METRIC RATING
222nd/ 347
METRIC RANK

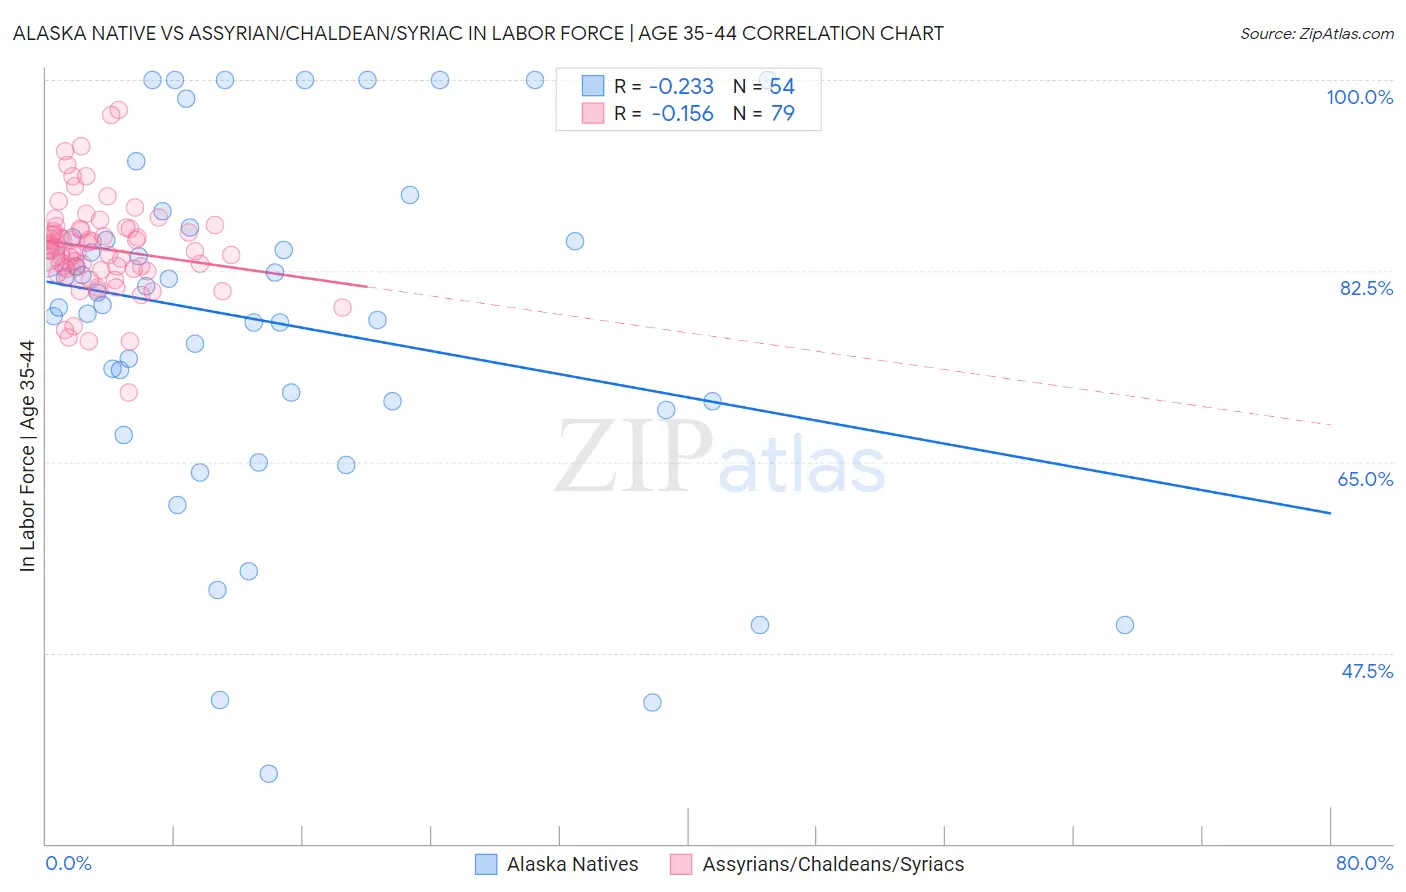
Alaska Native vs Assyrian/Chaldean/Syriac In Labor Force | Age 35-44 Correlation Chart

The statistical analysis conducted on geographies consisting of 76,764,235 people shows a weak negative correlation between the proportion of Alaska Natives and labor force participation rate among population between the ages 35 and 44 in the United States with a correlation coefficient (R) of -0.233 and weighted average of 81.6%. Similarly, the statistical analysis conducted on geographies consisting of 110,311,119 people shows a poor negative correlation between the proportion of Assyrians/Chaldeans/Syriacs and labor force participation rate among population between the ages 35 and 44 in the United States with a correlation coefficient (R) of -0.156 and weighted average of 84.0%, a difference of 2.9%.
Alaska Native vs Assyrian/Chaldean/Syriac In Labor Force | Age 35-44

In Labor Force | Age 35-44 Correlation Summary

MeasurementAlaska NativeAssyrian/Chaldean/Syriac
Minimum36.4%71.4%
Maximum100.0%97.2%
Range63.6%25.8%
Mean77.8%84.5%
Median79.9%84.4%
Interquartile 25% (IQ1)70.5%82.6%
Interquartile 75% (IQ3)85.5%86.4%
Interquartile Range (IQR)15.0%3.8%
Standard Deviation (Sample)15.9%4.3%
Standard Deviation (Population)15.7%4.3%

Similar Demographics by In Labor Force | Age 35-44

Demographics Similar to Alaska Natives by In Labor Force | Age 35-44

In terms of in labor force | age 35-44, the demographic groups most similar to Alaska Natives are Mexican (81.6%, a difference of 0.0%), Cajun (81.5%, a difference of 0.12%), Colville (81.7%, a difference of 0.14%), Immigrants from Mexico (81.5%, a difference of 0.14%), and Comanche (81.5%, a difference of 0.16%).
DemographicsRating | RankIn Labor Force | Age 35-44
Shoshone
0.0
/100
|
#305
Tragic
82.2%
Blacks/African Americans
0.0
/100
|
#306
Tragic
82.2%
Hispanics or Latinos
0.0
/100
|
#307
Tragic
82.1%
Immigrants | Central America
0.0
/100
|
#308
Tragic
82.0%
Cree
0.0
/100
|
#309
Tragic
82.0%
Blackfeet
0.0
/100
|
#310
Tragic
81.9%
Colville
0.0
/100
|
#311
Tragic
81.7%
Alaska Natives
0.0
/100
|
#312
Tragic
81.6%
Mexicans
0.0
/100
|
#313
Tragic
81.6%
Cajuns
0.0
/100
|
#314
Tragic
81.5%
Immigrants | Mexico
0.0
/100
|
#315
Tragic
81.5%
Comanche
0.0
/100
|
#316
Tragic
81.5%
Cherokee
0.0
/100
|
#317
Tragic
81.4%
Alaskan Athabascans
0.0
/100
|
#318
Tragic
81.3%
Inupiat
0.0
/100
|
#319
Tragic
80.9%

Demographics Similar to Assyrians/Chaldeans/Syriacs by In Labor Force | Age 35-44

In terms of in labor force | age 35-44, the demographic groups most similar to Assyrians/Chaldeans/Syriacs are Icelander (84.0%, a difference of 0.0%), Immigrants from Panama (84.0%, a difference of 0.0%), U.S. Virgin Islander (84.0%, a difference of 0.010%), Immigrants from Burma/Myanmar (84.0%, a difference of 0.010%), and French (84.0%, a difference of 0.020%).
DemographicsRating | RankIn Labor Force | Age 35-44
Europeans
12.2
/100
|
#215
Poor
84.1%
Nicaraguans
12.1
/100
|
#216
Poor
84.1%
Immigrants | Norway
11.7
/100
|
#217
Poor
84.1%
Immigrants | Nicaragua
9.4
/100
|
#218
Tragic
84.1%
Sub-Saharan Africans
9.3
/100
|
#219
Tragic
84.1%
French
7.5
/100
|
#220
Tragic
84.0%
Icelanders
6.7
/100
|
#221
Tragic
84.0%
Assyrians/Chaldeans/Syriacs
6.6
/100
|
#222
Tragic
84.0%
Immigrants | Panama
6.4
/100
|
#223
Tragic
84.0%
U.S. Virgin Islanders
6.1
/100
|
#224
Tragic
84.0%
Immigrants | Burma/Myanmar
6.1
/100
|
#225
Tragic
84.0%
Panamanians
5.4
/100
|
#226
Tragic
84.0%
British West Indians
5.3
/100
|
#227
Tragic
84.0%
Welsh
5.3
/100
|
#228
Tragic
84.0%
Immigrants | Thailand
4.7
/100
|
#229
Tragic
84.0%