Trinidadian and Tobagonian vs Assyrian/Chaldean/Syriac Associate's Degree
COMPARE
Trinidadian and Tobagonian
Assyrian/Chaldean/Syriac
Associate's Degree
Associate's Degree Comparison
Trinidadians and Tobagonians
Assyrians/Chaldeans/Syriacs
43.6%
ASSOCIATE'S DEGREE
4.0/ 100
METRIC RATING
227th/ 347
METRIC RANK
48.2%
ASSOCIATE'S DEGREE
89.4/ 100
METRIC RATING
133rd/ 347
METRIC RANK
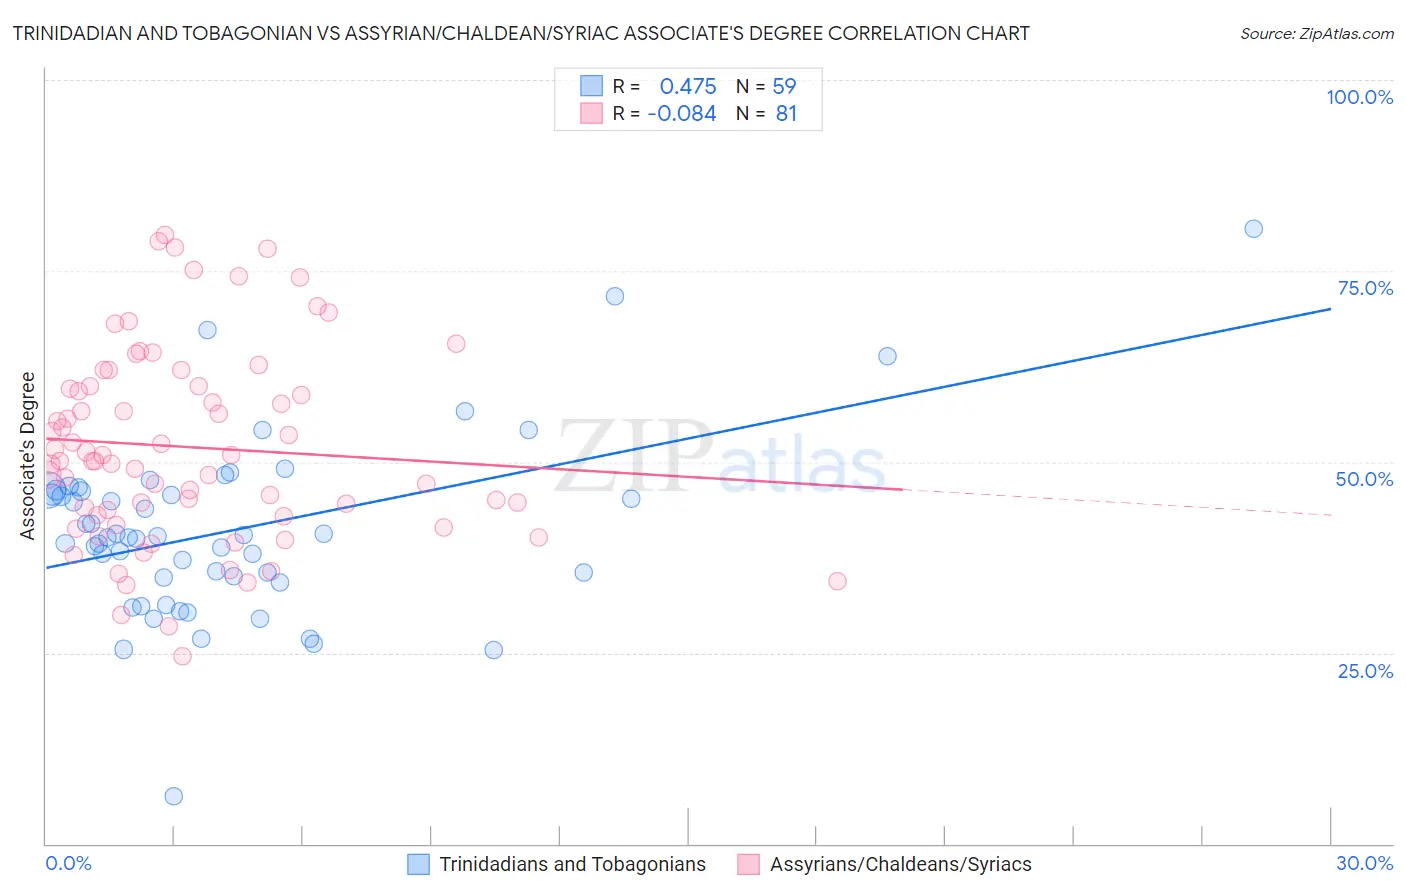
Trinidadian and Tobagonian vs Assyrian/Chaldean/Syriac Associate's Degree Correlation Chart
The statistical analysis conducted on geographies consisting of 219,861,537 people shows a moderate positive correlation between the proportion of Trinidadians and Tobagonians and percentage of population with at least associate's degree education in the United States with a correlation coefficient (R) of 0.475 and weighted average of 43.6%. Similarly, the statistical analysis conducted on geographies consisting of 110,318,304 people shows a slight negative correlation between the proportion of Assyrians/Chaldeans/Syriacs and percentage of population with at least associate's degree education in the United States with a correlation coefficient (R) of -0.084 and weighted average of 48.2%, a difference of 10.6%.
Associate's Degree Correlation Summary
| Measurement | Trinidadian and Tobagonian | Assyrian/Chaldean/Syriac |
| Minimum | 6.2% | 24.5% |
| Maximum | 80.5% | 79.8% |
| Range | 74.4% | 55.3% |
| Mean | 41.1% | 51.9% |
| Median | 40.2% | 50.1% |
| Interquartile 25% (IQ1) | 34.9% | 43.0% |
| Interquartile 75% (IQ3) | 46.3% | 59.9% |
| Interquartile Range (IQR) | 11.4% | 16.9% |
| Standard Deviation (Sample) | 11.9% | 12.7% |
| Standard Deviation (Population) | 11.8% | 12.6% |
Similar Demographics by Associate's Degree
Demographics Similar to Trinidadians and Tobagonians by Associate's Degree
In terms of associate's degree, the demographic groups most similar to Trinidadians and Tobagonians are Immigrants from Burma/Myanmar (43.7%, a difference of 0.17%), Guamanian/Chamorro (43.8%, a difference of 0.39%), Hmong (43.4%, a difference of 0.44%), West Indian (43.8%, a difference of 0.54%), and Immigrants from Trinidad and Tobago (43.3%, a difference of 0.60%).
| Demographics | Rating | Rank | Associate's Degree |
| Portuguese | 7.2 /100 | #220 | Tragic 44.1% |
| Immigrants | Western Africa | 6.6 /100 | #221 | Tragic 44.1% |
| Barbadians | 5.8 /100 | #222 | Tragic 43.9% |
| Sub-Saharan Africans | 5.5 /100 | #223 | Tragic 43.9% |
| West Indians | 5.2 /100 | #224 | Tragic 43.8% |
| Guamanians/Chamorros | 4.8 /100 | #225 | Tragic 43.8% |
| Immigrants | Burma/Myanmar | 4.3 /100 | #226 | Tragic 43.7% |
| Trinidadians and Tobagonians | 4.0 /100 | #227 | Tragic 43.6% |
| Hmong | 3.2 /100 | #228 | Tragic 43.4% |
| Immigrants | Trinidad and Tobago | 3.0 /100 | #229 | Tragic 43.3% |
| Immigrants | Barbados | 2.9 /100 | #230 | Tragic 43.3% |
| Liberians | 2.9 /100 | #231 | Tragic 43.3% |
| Native Hawaiians | 2.3 /100 | #232 | Tragic 43.1% |
| Tongans | 2.2 /100 | #233 | Tragic 43.0% |
| Tlingit-Haida | 2.1 /100 | #234 | Tragic 43.0% |
Demographics Similar to Assyrians/Chaldeans/Syriacs by Associate's Degree
In terms of associate's degree, the demographic groups most similar to Assyrians/Chaldeans/Syriacs are Moroccan (48.2%, a difference of 0.020%), Immigrants from Albania (48.2%, a difference of 0.080%), European (48.2%, a difference of 0.080%), Pakistani (48.1%, a difference of 0.26%), and Icelander (48.3%, a difference of 0.27%).
| Demographics | Rating | Rank | Associate's Degree |
| Immigrants | Syria | 92.2 /100 | #126 | Exceptional 48.5% |
| Immigrants | Uganda | 92.1 /100 | #127 | Exceptional 48.5% |
| Immigrants | Eastern Africa | 91.6 /100 | #128 | Exceptional 48.4% |
| Swedes | 91.5 /100 | #129 | Exceptional 48.4% |
| Immigrants | Jordan | 91.2 /100 | #130 | Exceptional 48.4% |
| Icelanders | 90.8 /100 | #131 | Exceptional 48.3% |
| Immigrants | Albania | 89.9 /100 | #132 | Excellent 48.2% |
| Assyrians/Chaldeans/Syriacs | 89.4 /100 | #133 | Excellent 48.2% |
| Moroccans | 89.3 /100 | #134 | Excellent 48.2% |
| Europeans | 89.0 /100 | #135 | Excellent 48.2% |
| Pakistanis | 88.0 /100 | #136 | Excellent 48.1% |
| Immigrants | Eritrea | 87.8 /100 | #137 | Excellent 48.1% |
| Poles | 87.3 /100 | #138 | Excellent 48.0% |
| Slovenes | 85.1 /100 | #139 | Excellent 47.9% |
| Immigrants | Southern Europe | 84.4 /100 | #140 | Excellent 47.8% |