Immigrants from Eastern Asia vs Assyrian/Chaldean/Syriac Associate's Degree
COMPARE
Immigrants from Eastern Asia
Assyrian/Chaldean/Syriac
Associate's Degree
Associate's Degree Comparison
Immigrants from Eastern Asia
Assyrians/Chaldeans/Syriacs
55.4%
ASSOCIATE'S DEGREE
100.0/ 100
METRIC RATING
15th/ 347
METRIC RANK
48.2%
ASSOCIATE'S DEGREE
89.4/ 100
METRIC RATING
133rd/ 347
METRIC RANK
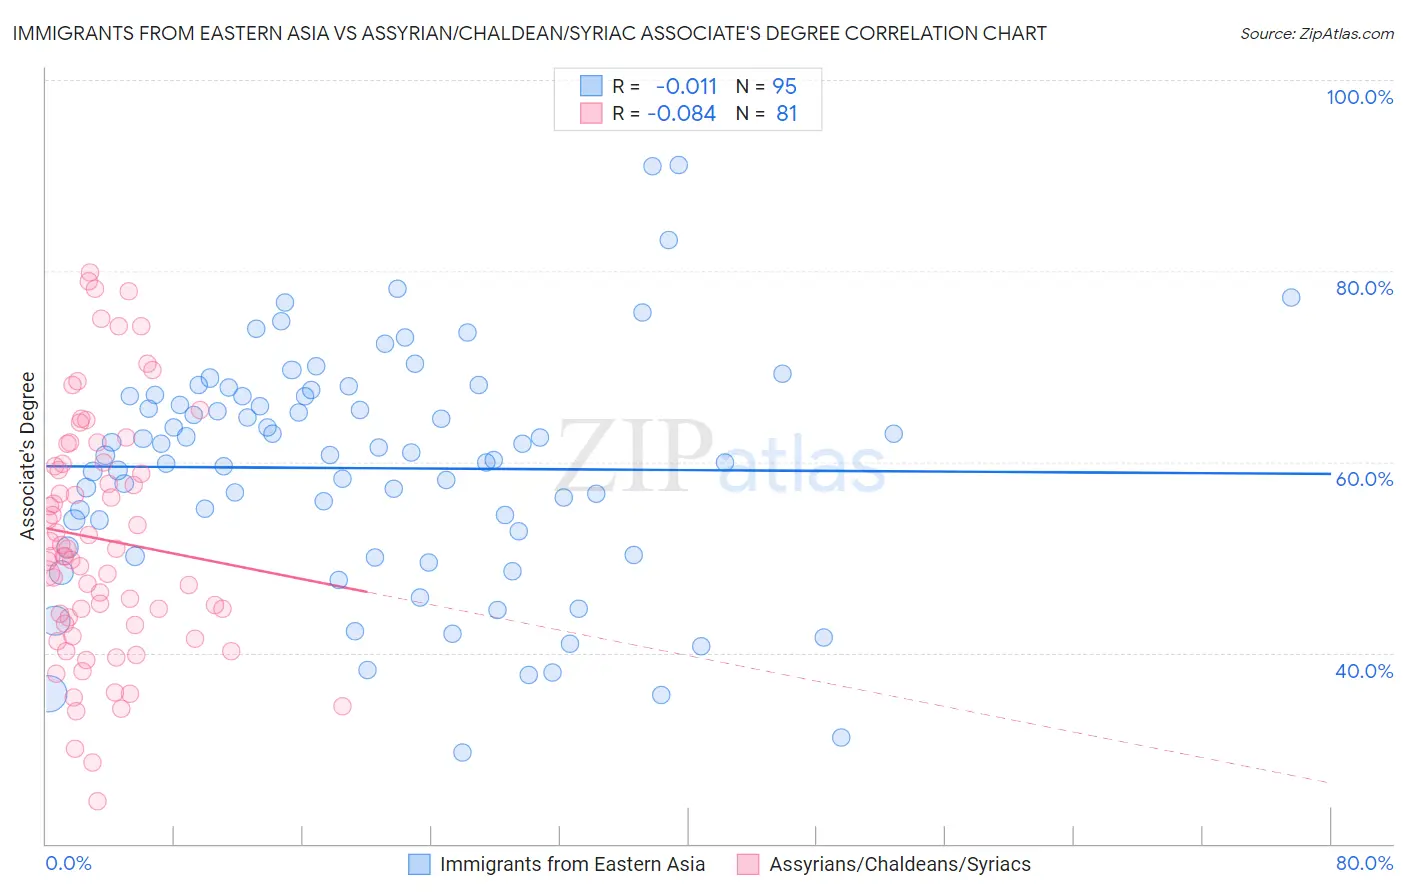
Immigrants from Eastern Asia vs Assyrian/Chaldean/Syriac Associate's Degree Correlation Chart
The statistical analysis conducted on geographies consisting of 499,873,400 people shows no correlation between the proportion of Immigrants from Eastern Asia and percentage of population with at least associate's degree education in the United States with a correlation coefficient (R) of -0.011 and weighted average of 55.4%. Similarly, the statistical analysis conducted on geographies consisting of 110,318,304 people shows a slight negative correlation between the proportion of Assyrians/Chaldeans/Syriacs and percentage of population with at least associate's degree education in the United States with a correlation coefficient (R) of -0.084 and weighted average of 48.2%, a difference of 14.9%.
Associate's Degree Correlation Summary
| Measurement | Immigrants from Eastern Asia | Assyrian/Chaldean/Syriac |
| Minimum | 29.6% | 24.5% |
| Maximum | 91.1% | 79.8% |
| Range | 61.5% | 55.3% |
| Mean | 59.3% | 51.9% |
| Median | 60.8% | 50.1% |
| Interquartile 25% (IQ1) | 51.1% | 43.0% |
| Interquartile 75% (IQ3) | 66.9% | 59.9% |
| Interquartile Range (IQR) | 15.8% | 16.9% |
| Standard Deviation (Sample) | 12.2% | 12.7% |
| Standard Deviation (Population) | 12.2% | 12.6% |
Similar Demographics by Associate's Degree
Demographics Similar to Immigrants from Eastern Asia by Associate's Degree
In terms of associate's degree, the demographic groups most similar to Immigrants from Eastern Asia are Immigrants from Hong Kong (55.4%, a difference of 0.030%), Immigrants from China (55.5%, a difference of 0.17%), Soviet Union (55.1%, a difference of 0.47%), Eastern European (55.0%, a difference of 0.61%), and Immigrants from South Central Asia (55.7%, a difference of 0.67%).
| Demographics | Rating | Rank | Associate's Degree |
| Thais | 100.0 /100 | #8 | Exceptional 57.4% |
| Immigrants | Israel | 100.0 /100 | #9 | Exceptional 56.8% |
| Cypriots | 100.0 /100 | #10 | Exceptional 56.4% |
| Immigrants | Australia | 100.0 /100 | #11 | Exceptional 55.8% |
| Immigrants | South Central Asia | 100.0 /100 | #12 | Exceptional 55.7% |
| Immigrants | China | 100.0 /100 | #13 | Exceptional 55.5% |
| Immigrants | Hong Kong | 100.0 /100 | #14 | Exceptional 55.4% |
| Immigrants | Eastern Asia | 100.0 /100 | #15 | Exceptional 55.4% |
| Soviet Union | 100.0 /100 | #16 | Exceptional 55.1% |
| Eastern Europeans | 100.0 /100 | #17 | Exceptional 55.0% |
| Indians (Asian) | 100.0 /100 | #18 | Exceptional 54.8% |
| Immigrants | Ireland | 100.0 /100 | #19 | Exceptional 54.7% |
| Cambodians | 100.0 /100 | #20 | Exceptional 54.6% |
| Immigrants | Sweden | 100.0 /100 | #21 | Exceptional 54.6% |
| Immigrants | Japan | 100.0 /100 | #22 | Exceptional 54.6% |
Demographics Similar to Assyrians/Chaldeans/Syriacs by Associate's Degree
In terms of associate's degree, the demographic groups most similar to Assyrians/Chaldeans/Syriacs are Moroccan (48.2%, a difference of 0.020%), Immigrants from Albania (48.2%, a difference of 0.080%), European (48.2%, a difference of 0.080%), Pakistani (48.1%, a difference of 0.26%), and Icelander (48.3%, a difference of 0.27%).
| Demographics | Rating | Rank | Associate's Degree |
| Immigrants | Syria | 92.2 /100 | #126 | Exceptional 48.5% |
| Immigrants | Uganda | 92.1 /100 | #127 | Exceptional 48.5% |
| Immigrants | Eastern Africa | 91.6 /100 | #128 | Exceptional 48.4% |
| Swedes | 91.5 /100 | #129 | Exceptional 48.4% |
| Immigrants | Jordan | 91.2 /100 | #130 | Exceptional 48.4% |
| Icelanders | 90.8 /100 | #131 | Exceptional 48.3% |
| Immigrants | Albania | 89.9 /100 | #132 | Excellent 48.2% |
| Assyrians/Chaldeans/Syriacs | 89.4 /100 | #133 | Excellent 48.2% |
| Moroccans | 89.3 /100 | #134 | Excellent 48.2% |
| Europeans | 89.0 /100 | #135 | Excellent 48.2% |
| Pakistanis | 88.0 /100 | #136 | Excellent 48.1% |
| Immigrants | Eritrea | 87.8 /100 | #137 | Excellent 48.1% |
| Poles | 87.3 /100 | #138 | Excellent 48.0% |
| Slovenes | 85.1 /100 | #139 | Excellent 47.9% |
| Immigrants | Southern Europe | 84.4 /100 | #140 | Excellent 47.8% |