Osage vs Assyrian/Chaldean/Syriac Associate's Degree
COMPARE
Osage
Assyrian/Chaldean/Syriac
Associate's Degree
Associate's Degree Comparison
Osage
Assyrians/Chaldeans/Syriacs
41.5%
ASSOCIATE'S DEGREE
0.3/ 100
METRIC RATING
264th/ 347
METRIC RANK
48.2%
ASSOCIATE'S DEGREE
89.4/ 100
METRIC RATING
133rd/ 347
METRIC RANK
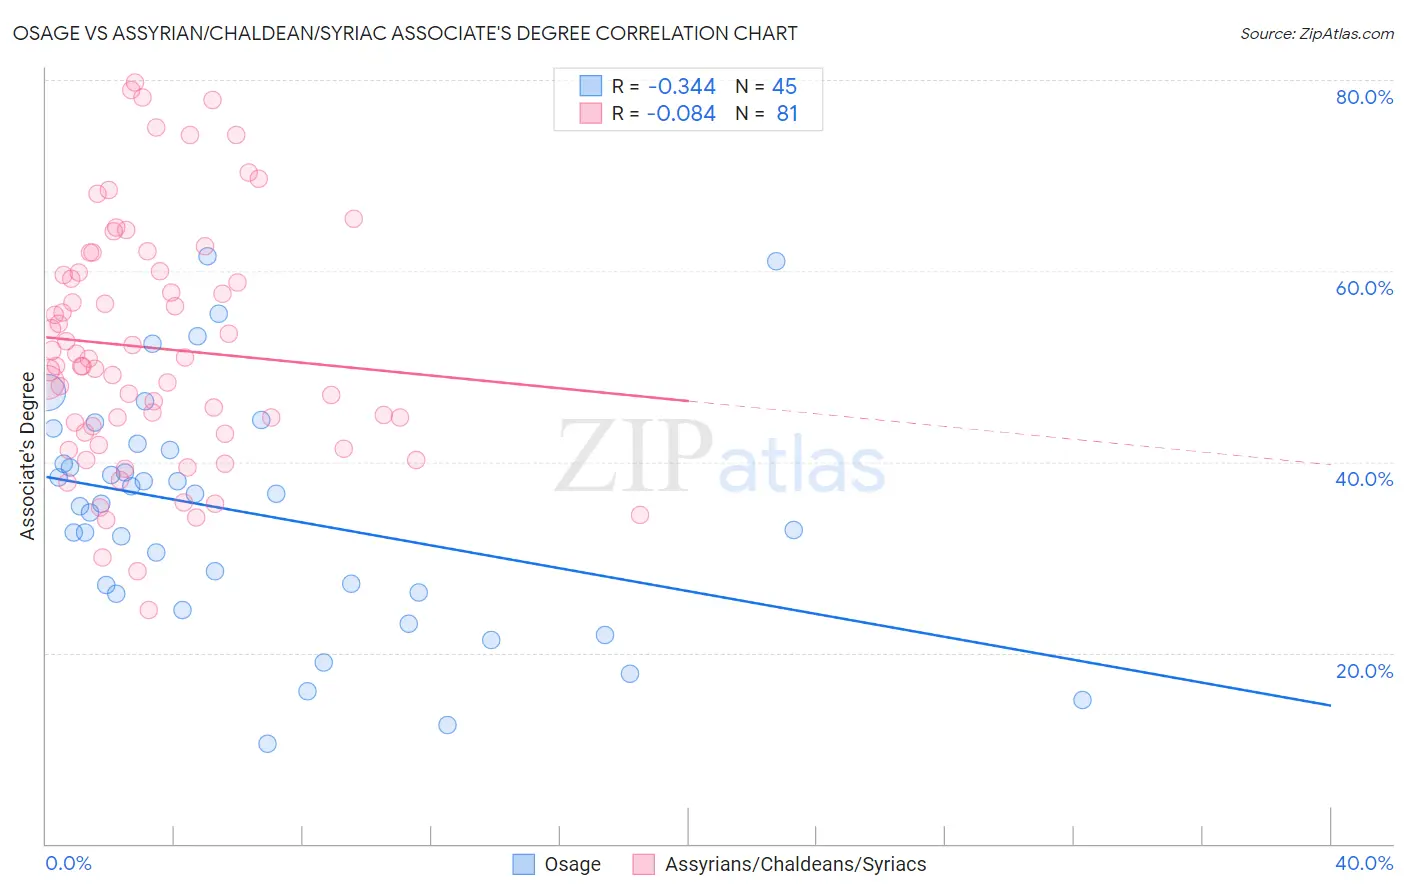
Osage vs Assyrian/Chaldean/Syriac Associate's Degree Correlation Chart
The statistical analysis conducted on geographies consisting of 91,808,929 people shows a mild negative correlation between the proportion of Osage and percentage of population with at least associate's degree education in the United States with a correlation coefficient (R) of -0.344 and weighted average of 41.5%. Similarly, the statistical analysis conducted on geographies consisting of 110,318,304 people shows a slight negative correlation between the proportion of Assyrians/Chaldeans/Syriacs and percentage of population with at least associate's degree education in the United States with a correlation coefficient (R) of -0.084 and weighted average of 48.2%, a difference of 16.3%.
Associate's Degree Correlation Summary
| Measurement | Osage | Assyrian/Chaldean/Syriac |
| Minimum | 10.4% | 24.5% |
| Maximum | 61.5% | 79.8% |
| Range | 51.1% | 55.3% |
| Mean | 34.6% | 51.9% |
| Median | 35.6% | 50.1% |
| Interquartile 25% (IQ1) | 26.3% | 43.0% |
| Interquartile 75% (IQ3) | 41.5% | 59.9% |
| Interquartile Range (IQR) | 15.3% | 16.9% |
| Standard Deviation (Sample) | 12.2% | 12.7% |
| Standard Deviation (Population) | 12.1% | 12.6% |
Similar Demographics by Associate's Degree
Demographics Similar to Osage by Associate's Degree
In terms of associate's degree, the demographic groups most similar to Osage are Immigrants from Jamaica (41.5%, a difference of 0.010%), Bahamian (41.5%, a difference of 0.030%), Nicaraguan (41.5%, a difference of 0.12%), Marshallese (41.6%, a difference of 0.25%), and Malaysian (41.6%, a difference of 0.44%).
| Demographics | Rating | Rank | Associate's Degree |
| Spanish Americans | 0.5 /100 | #257 | Tragic 41.8% |
| Japanese | 0.5 /100 | #258 | Tragic 41.7% |
| Malaysians | 0.4 /100 | #259 | Tragic 41.6% |
| Marshallese | 0.4 /100 | #260 | Tragic 41.6% |
| Nicaraguans | 0.4 /100 | #261 | Tragic 41.5% |
| Bahamians | 0.4 /100 | #262 | Tragic 41.5% |
| Immigrants | Jamaica | 0.3 /100 | #263 | Tragic 41.5% |
| Osage | 0.3 /100 | #264 | Tragic 41.5% |
| Africans | 0.2 /100 | #265 | Tragic 41.1% |
| Samoans | 0.2 /100 | #266 | Tragic 41.1% |
| Hawaiians | 0.2 /100 | #267 | Tragic 40.9% |
| Central American Indians | 0.2 /100 | #268 | Tragic 40.8% |
| Americans | 0.2 /100 | #269 | Tragic 40.8% |
| Chippewa | 0.2 /100 | #270 | Tragic 40.7% |
| Immigrants | Laos | 0.1 /100 | #271 | Tragic 40.7% |
Demographics Similar to Assyrians/Chaldeans/Syriacs by Associate's Degree
In terms of associate's degree, the demographic groups most similar to Assyrians/Chaldeans/Syriacs are Moroccan (48.2%, a difference of 0.020%), Immigrants from Albania (48.2%, a difference of 0.080%), European (48.2%, a difference of 0.080%), Pakistani (48.1%, a difference of 0.26%), and Icelander (48.3%, a difference of 0.27%).
| Demographics | Rating | Rank | Associate's Degree |
| Immigrants | Syria | 92.2 /100 | #126 | Exceptional 48.5% |
| Immigrants | Uganda | 92.1 /100 | #127 | Exceptional 48.5% |
| Immigrants | Eastern Africa | 91.6 /100 | #128 | Exceptional 48.4% |
| Swedes | 91.5 /100 | #129 | Exceptional 48.4% |
| Immigrants | Jordan | 91.2 /100 | #130 | Exceptional 48.4% |
| Icelanders | 90.8 /100 | #131 | Exceptional 48.3% |
| Immigrants | Albania | 89.9 /100 | #132 | Excellent 48.2% |
| Assyrians/Chaldeans/Syriacs | 89.4 /100 | #133 | Excellent 48.2% |
| Moroccans | 89.3 /100 | #134 | Excellent 48.2% |
| Europeans | 89.0 /100 | #135 | Excellent 48.2% |
| Pakistanis | 88.0 /100 | #136 | Excellent 48.1% |
| Immigrants | Eritrea | 87.8 /100 | #137 | Excellent 48.1% |
| Poles | 87.3 /100 | #138 | Excellent 48.0% |
| Slovenes | 85.1 /100 | #139 | Excellent 47.9% |
| Immigrants | Southern Europe | 84.4 /100 | #140 | Excellent 47.8% |