Yup'ik vs Latvian Disability
COMPARE
Yup'ik
Latvian
Disability
Disability Comparison
Yup'ik
Latvians
12.2%
DISABILITY
2.2/ 100
METRIC RATING
235th/ 347
METRIC RANK
11.4%
DISABILITY
89.8/ 100
METRIC RATING
130th/ 347
METRIC RANK
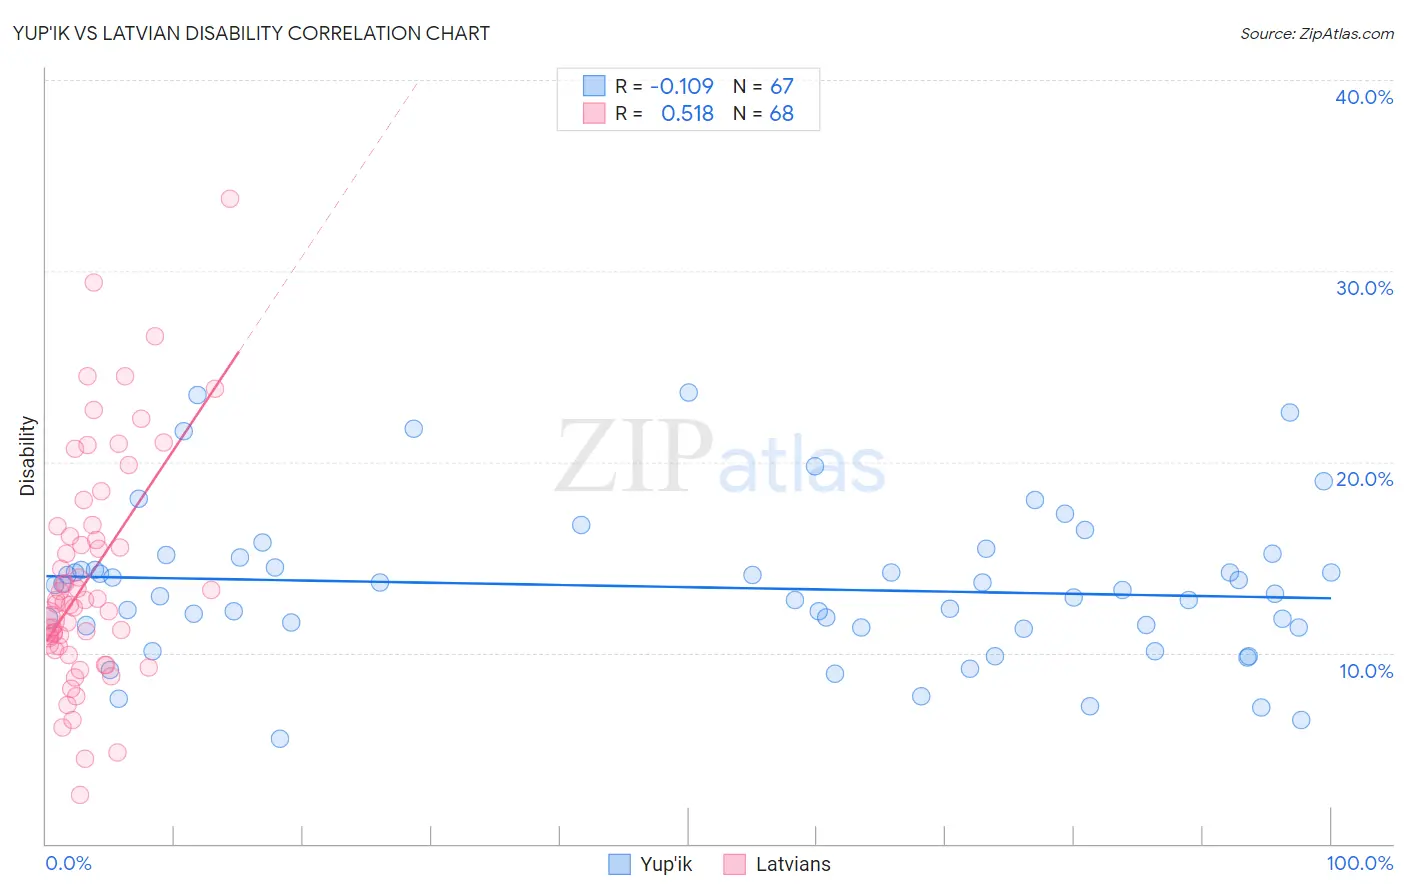
Yup'ik vs Latvian Disability Correlation Chart
The statistical analysis conducted on geographies consisting of 39,961,482 people shows a poor negative correlation between the proportion of Yup'ik and percentage of population with a disability in the United States with a correlation coefficient (R) of -0.109 and weighted average of 12.2%. Similarly, the statistical analysis conducted on geographies consisting of 220,718,032 people shows a substantial positive correlation between the proportion of Latvians and percentage of population with a disability in the United States with a correlation coefficient (R) of 0.518 and weighted average of 11.4%, a difference of 6.8%.
Disability Correlation Summary
| Measurement | Yup'ik | Latvian |
| Minimum | 5.5% | 2.6% |
| Maximum | 23.6% | 33.8% |
| Range | 18.1% | 31.2% |
| Mean | 13.4% | 13.9% |
| Median | 13.3% | 12.6% |
| Interquartile 25% (IQ1) | 11.3% | 10.4% |
| Interquartile 75% (IQ3) | 15.0% | 16.4% |
| Interquartile Range (IQR) | 3.7% | 6.0% |
| Standard Deviation (Sample) | 3.9% | 6.0% |
| Standard Deviation (Population) | 3.9% | 5.9% |
Similar Demographics by Disability
Demographics Similar to Yup'ik by Disability
In terms of disability, the demographic groups most similar to Yup'ik are Japanese (12.2%, a difference of 0.040%), Bahamian (12.2%, a difference of 0.070%), Chinese (12.2%, a difference of 0.090%), Immigrants from Congo (12.2%, a difference of 0.14%), and Italian (12.2%, a difference of 0.16%).
| Demographics | Rating | Rank | Disability |
| West Indians | 2.9 /100 | #228 | Tragic 12.2% |
| Inupiat | 2.8 /100 | #229 | Tragic 12.2% |
| Samoans | 2.6 /100 | #230 | Tragic 12.2% |
| Malaysians | 2.5 /100 | #231 | Tragic 12.2% |
| Italians | 2.5 /100 | #232 | Tragic 12.2% |
| Bahamians | 2.3 /100 | #233 | Tragic 12.2% |
| Japanese | 2.3 /100 | #234 | Tragic 12.2% |
| Yup'ik | 2.2 /100 | #235 | Tragic 12.2% |
| Chinese | 2.0 /100 | #236 | Tragic 12.2% |
| Immigrants | Congo | 1.9 /100 | #237 | Tragic 12.2% |
| Norwegians | 1.9 /100 | #238 | Tragic 12.2% |
| Swedes | 1.8 /100 | #239 | Tragic 12.2% |
| Hungarians | 1.7 /100 | #240 | Tragic 12.2% |
| Yugoslavians | 1.7 /100 | #241 | Tragic 12.2% |
| Poles | 1.7 /100 | #242 | Tragic 12.2% |
Demographics Similar to Latvians by Disability
In terms of disability, the demographic groups most similar to Latvians are Immigrants from Croatia (11.4%, a difference of 0.010%), Macedonian (11.4%, a difference of 0.060%), Immigrants from Italy (11.4%, a difference of 0.070%), Immigrants from Europe (11.4%, a difference of 0.070%), and Immigrants from Africa (11.4%, a difference of 0.070%).
| Demographics | Rating | Rank | Disability |
| South Africans | 92.3 /100 | #123 | Exceptional 11.4% |
| South American Indians | 92.2 /100 | #124 | Exceptional 11.4% |
| Costa Ricans | 91.9 /100 | #125 | Exceptional 11.4% |
| Immigrants | Latvia | 90.9 /100 | #126 | Exceptional 11.4% |
| Immigrants | Italy | 90.4 /100 | #127 | Exceptional 11.4% |
| Immigrants | Europe | 90.4 /100 | #128 | Exceptional 11.4% |
| Macedonians | 90.3 /100 | #129 | Exceptional 11.4% |
| Latvians | 89.8 /100 | #130 | Excellent 11.4% |
| Immigrants | Croatia | 89.8 /100 | #131 | Excellent 11.4% |
| Immigrants | Africa | 89.3 /100 | #132 | Excellent 11.4% |
| Arabs | 89.1 /100 | #133 | Excellent 11.4% |
| Immigrants | Guyana | 88.3 /100 | #134 | Excellent 11.4% |
| Ugandans | 87.9 /100 | #135 | Excellent 11.4% |
| Immigrants | St. Vincent and the Grenadines | 87.8 /100 | #136 | Excellent 11.4% |
| Kenyans | 87.1 /100 | #137 | Excellent 11.5% |