Immigrants from Laos vs Latvian Male Disability
COMPARE
Immigrants from Laos
Latvian
Male Disability
Male Disability Comparison
Immigrants from Laos
Latvians
11.9%
MALE DISABILITY
1.0/ 100
METRIC RATING
244th/ 347
METRIC RANK
11.1%
MALE DISABILITY
68.1/ 100
METRIC RATING
158th/ 347
METRIC RANK
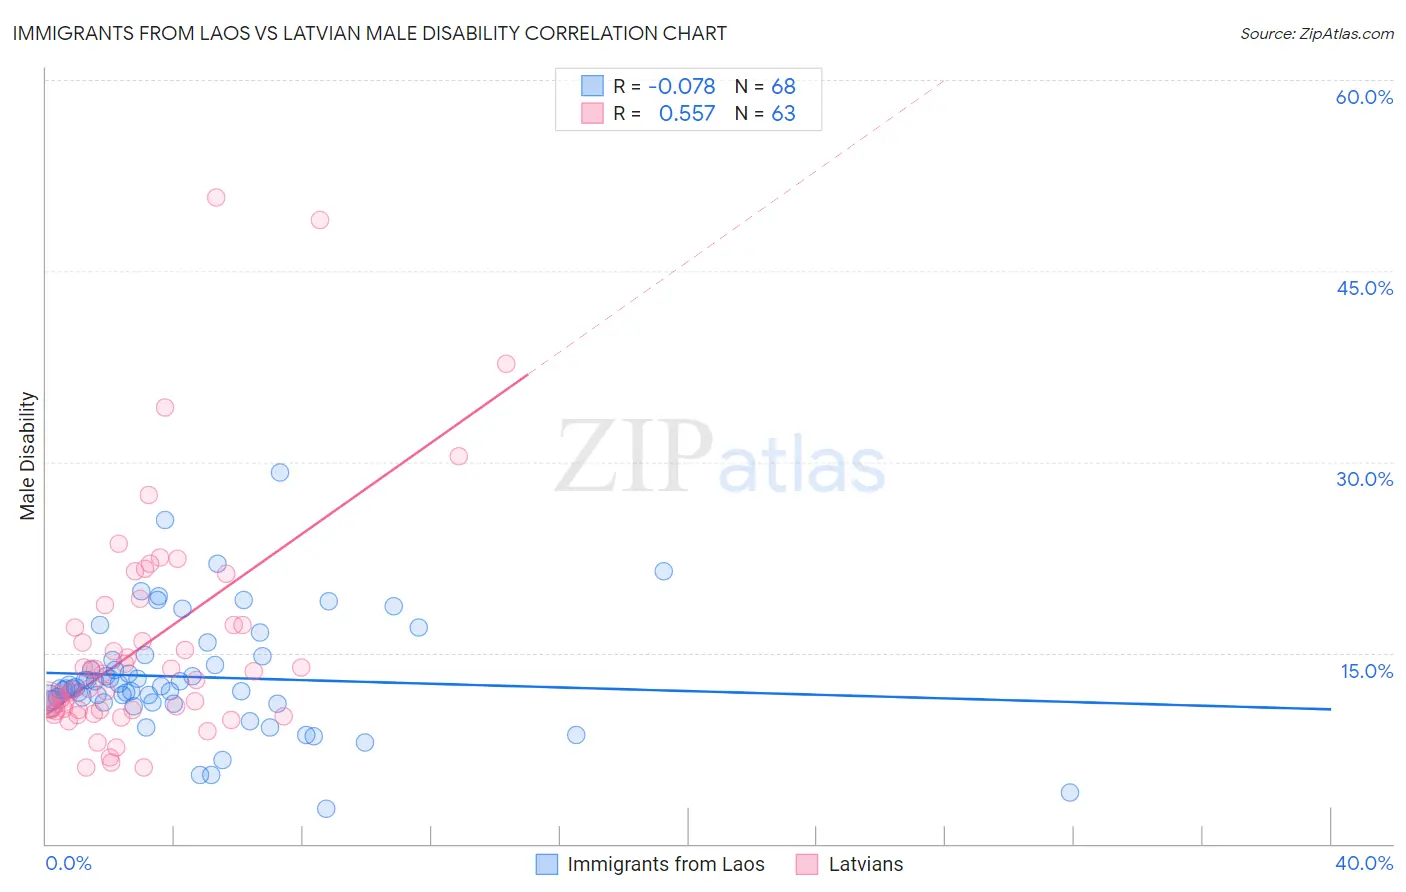
Immigrants from Laos vs Latvian Male Disability Correlation Chart
The statistical analysis conducted on geographies consisting of 201,462,154 people shows a slight negative correlation between the proportion of Immigrants from Laos and percentage of males with a disability in the United States with a correlation coefficient (R) of -0.078 and weighted average of 11.9%. Similarly, the statistical analysis conducted on geographies consisting of 220,715,476 people shows a substantial positive correlation between the proportion of Latvians and percentage of males with a disability in the United States with a correlation coefficient (R) of 0.557 and weighted average of 11.1%, a difference of 7.5%.
Male Disability Correlation Summary
| Measurement | Immigrants from Laos | Latvian |
| Minimum | 2.7% | 6.0% |
| Maximum | 29.2% | 50.8% |
| Range | 26.5% | 44.8% |
| Mean | 13.1% | 15.6% |
| Median | 12.2% | 12.8% |
| Interquartile 25% (IQ1) | 11.1% | 10.5% |
| Interquartile 75% (IQ3) | 14.6% | 17.2% |
| Interquartile Range (IQR) | 3.5% | 6.7% |
| Standard Deviation (Sample) | 4.6% | 9.0% |
| Standard Deviation (Population) | 4.6% | 8.9% |
Similar Demographics by Male Disability
Demographics Similar to Immigrants from Laos by Male Disability
In terms of male disability, the demographic groups most similar to Immigrants from Laos are Immigrants from Liberia (11.9%, a difference of 0.0%), Danish (11.9%, a difference of 0.040%), Samoan (11.9%, a difference of 0.11%), Northern European (11.9%, a difference of 0.14%), and Bahamian (11.9%, a difference of 0.16%).
| Demographics | Rating | Rank | Male Disability |
| Carpatho Rusyns | 1.3 /100 | #237 | Tragic 11.9% |
| Yugoslavians | 1.2 /100 | #238 | Tragic 11.9% |
| Italians | 1.2 /100 | #239 | Tragic 11.9% |
| Czechs | 1.1 /100 | #240 | Tragic 11.9% |
| Bahamians | 1.1 /100 | #241 | Tragic 11.9% |
| Northern Europeans | 1.1 /100 | #242 | Tragic 11.9% |
| Samoans | 1.1 /100 | #243 | Tragic 11.9% |
| Immigrants | Laos | 1.0 /100 | #244 | Tragic 11.9% |
| Immigrants | Liberia | 1.0 /100 | #245 | Tragic 11.9% |
| Danes | 0.9 /100 | #246 | Tragic 11.9% |
| Hungarians | 0.8 /100 | #247 | Tragic 12.0% |
| Poles | 0.7 /100 | #248 | Tragic 12.0% |
| Immigrants | Yemen | 0.5 /100 | #249 | Tragic 12.0% |
| Bangladeshis | 0.5 /100 | #250 | Tragic 12.0% |
| German Russians | 0.5 /100 | #251 | Tragic 12.0% |
Demographics Similar to Latvians by Male Disability
In terms of male disability, the demographic groups most similar to Latvians are Guatemalan (11.1%, a difference of 0.060%), Immigrants from Western Africa (11.1%, a difference of 0.070%), Russian (11.1%, a difference of 0.11%), Albanian (11.1%, a difference of 0.11%), and Immigrants from West Indies (11.1%, a difference of 0.16%).
| Demographics | Rating | Rank | Male Disability |
| Cubans | 74.9 /100 | #151 | Good 11.0% |
| Immigrants | Albania | 74.4 /100 | #152 | Good 11.0% |
| Immigrants | Northern Europe | 73.2 /100 | #153 | Good 11.1% |
| Immigrants | Moldova | 72.8 /100 | #154 | Good 11.1% |
| Immigrants | Middle Africa | 70.9 /100 | #155 | Good 11.1% |
| Russians | 69.8 /100 | #156 | Good 11.1% |
| Immigrants | Western Africa | 69.2 /100 | #157 | Good 11.1% |
| Latvians | 68.1 /100 | #158 | Good 11.1% |
| Guatemalans | 67.2 /100 | #159 | Good 11.1% |
| Albanians | 66.5 /100 | #160 | Good 11.1% |
| Immigrants | West Indies | 65.7 /100 | #161 | Good 11.1% |
| Immigrants | Haiti | 65.3 /100 | #162 | Good 11.1% |
| Immigrants | Kenya | 63.8 /100 | #163 | Good 11.1% |
| British West Indians | 62.8 /100 | #164 | Good 11.1% |
| Luxembourgers | 61.9 /100 | #165 | Good 11.1% |