Yup'ik vs Iroquois Disability Age 35 to 64
COMPARE
Yup'ik
Iroquois
Disability Age 35 to 64
Disability Age 35 to 64 Comparison
Yup'ik
Iroquois
16.9%
DISABILITY AGE 35 TO 64
0.0/ 100
METRIC RATING
344th/ 347
METRIC RANK
14.4%
DISABILITY AGE 35 TO 64
0.0/ 100
METRIC RATING
313th/ 347
METRIC RANK
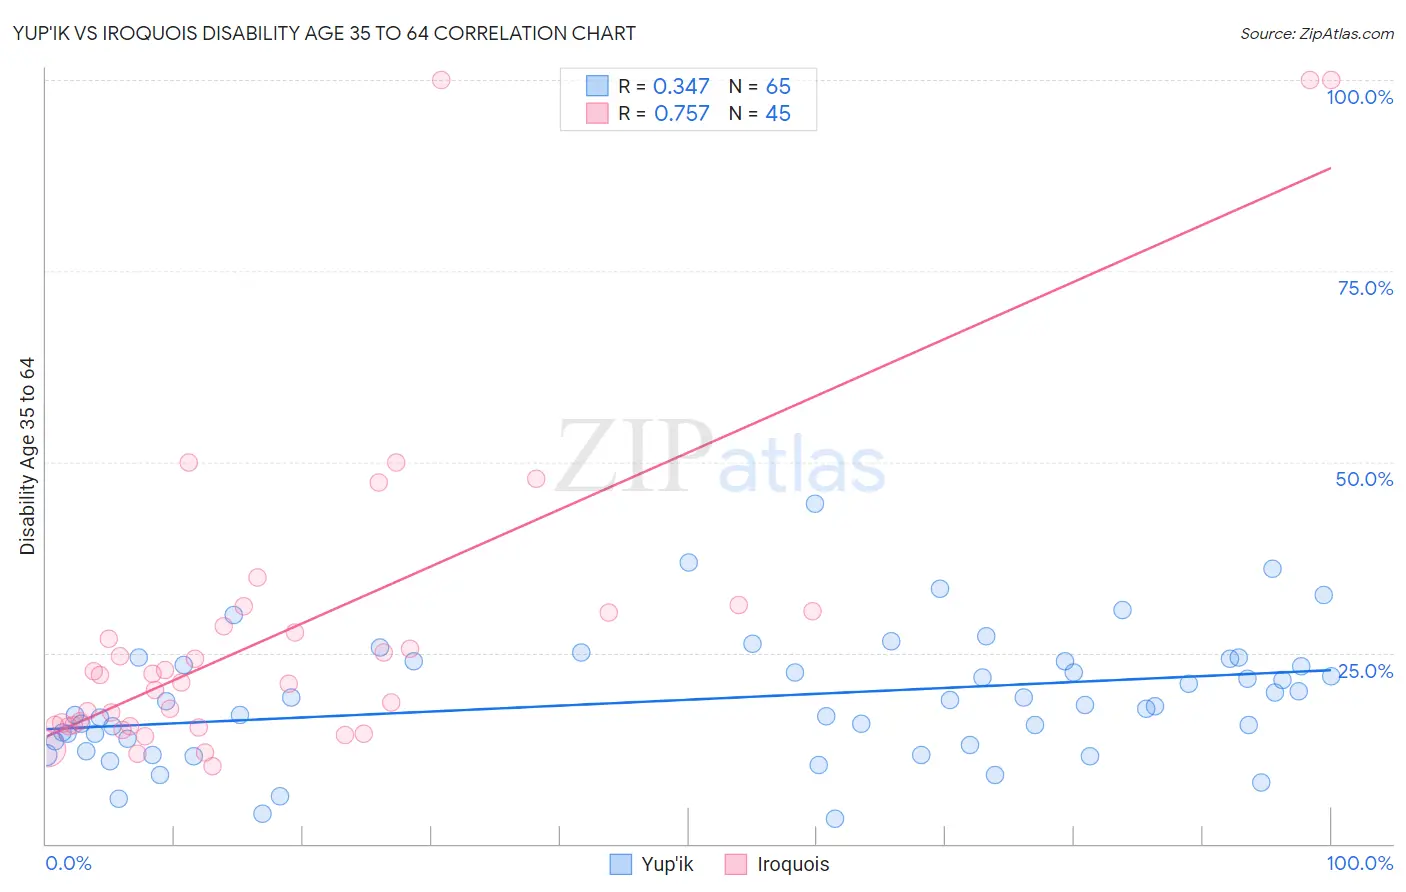
Yup'ik vs Iroquois Disability Age 35 to 64 Correlation Chart
The statistical analysis conducted on geographies consisting of 39,958,174 people shows a mild positive correlation between the proportion of Yup'ik and percentage of population with a disability between the ages 34 and 64 in the United States with a correlation coefficient (R) of 0.347 and weighted average of 16.9%. Similarly, the statistical analysis conducted on geographies consisting of 207,235,793 people shows a strong positive correlation between the proportion of Iroquois and percentage of population with a disability between the ages 34 and 64 in the United States with a correlation coefficient (R) of 0.757 and weighted average of 14.4%, a difference of 18.0%.
Disability Age 35 to 64 Correlation Summary
| Measurement | Yup'ik | Iroquois |
| Minimum | 3.2% | 10.2% |
| Maximum | 44.4% | 100.0% |
| Range | 41.2% | 89.8% |
| Mean | 18.9% | 28.2% |
| Median | 18.2% | 22.1% |
| Interquartile 25% (IQ1) | 13.2% | 15.5% |
| Interquartile 75% (IQ3) | 23.9% | 30.4% |
| Interquartile Range (IQR) | 10.6% | 14.9% |
| Standard Deviation (Sample) | 8.1% | 21.9% |
| Standard Deviation (Population) | 8.1% | 21.6% |
Similar Demographics by Disability Age 35 to 64
Demographics Similar to Yup'ik by Disability Age 35 to 64
In terms of disability age 35 to 64, the demographic groups most similar to Yup'ik are Creek (16.9%, a difference of 0.32%), Tohono O'odham (16.7%, a difference of 1.2%), Tsimshian (16.7%, a difference of 1.3%), Kiowa (17.4%, a difference of 2.5%), and Choctaw (16.4%, a difference of 3.2%).
| Demographics | Rating | Rank | Disability Age 35 to 64 |
| Yuman | 0.0 /100 | #333 | Tragic 15.8% |
| Colville | 0.0 /100 | #334 | Tragic 15.8% |
| Seminole | 0.0 /100 | #335 | Tragic 15.9% |
| Menominee | 0.0 /100 | #336 | Tragic 15.9% |
| Puerto Ricans | 0.0 /100 | #337 | Tragic 15.9% |
| Chickasaw | 0.0 /100 | #338 | Tragic 16.1% |
| Pima | 0.0 /100 | #339 | Tragic 16.1% |
| Choctaw | 0.0 /100 | #340 | Tragic 16.4% |
| Tsimshian | 0.0 /100 | #341 | Tragic 16.7% |
| Tohono O'odham | 0.0 /100 | #342 | Tragic 16.7% |
| Creek | 0.0 /100 | #343 | Tragic 16.9% |
| Yup'ik | 0.0 /100 | #344 | Tragic 16.9% |
| Kiowa | 0.0 /100 | #345 | Tragic 17.4% |
| Lumbee | 0.0 /100 | #346 | Tragic 17.6% |
| Houma | 0.0 /100 | #347 | Tragic 18.7% |
Demographics Similar to Iroquois by Disability Age 35 to 64
In terms of disability age 35 to 64, the demographic groups most similar to Iroquois are Paiute (14.3%, a difference of 0.44%), Immigrants from the Azores (14.3%, a difference of 0.58%), Shoshone (14.5%, a difference of 0.76%), Alaska Native (14.5%, a difference of 0.77%), and Osage (14.5%, a difference of 0.97%).
| Demographics | Rating | Rank | Disability Age 35 to 64 |
| Immigrants | Yemen | 0.0 /100 | #306 | Tragic 14.0% |
| Blackfeet | 0.0 /100 | #307 | Tragic 14.1% |
| Inupiat | 0.0 /100 | #308 | Tragic 14.1% |
| Cree | 0.0 /100 | #309 | Tragic 14.1% |
| Cape Verdeans | 0.0 /100 | #310 | Tragic 14.1% |
| Immigrants | Azores | 0.0 /100 | #311 | Tragic 14.3% |
| Paiute | 0.0 /100 | #312 | Tragic 14.3% |
| Iroquois | 0.0 /100 | #313 | Tragic 14.4% |
| Shoshone | 0.0 /100 | #314 | Tragic 14.5% |
| Alaska Natives | 0.0 /100 | #315 | Tragic 14.5% |
| Osage | 0.0 /100 | #316 | Tragic 14.5% |
| Crow | 0.0 /100 | #317 | Tragic 14.6% |
| Ottawa | 0.0 /100 | #318 | Tragic 14.6% |
| Immigrants | Cabo Verde | 0.0 /100 | #319 | Tragic 14.7% |
| Blacks/African Americans | 0.0 /100 | #320 | Tragic 14.7% |