Yup'ik vs German Russian Disability Age 35 to 64
COMPARE
Yup'ik
German Russian
Disability Age 35 to 64
Disability Age 35 to 64 Comparison
Yup'ik
German Russians
16.9%
DISABILITY AGE 35 TO 64
0.0/ 100
METRIC RATING
344th/ 347
METRIC RANK
12.5%
DISABILITY AGE 35 TO 64
0.5/ 100
METRIC RATING
260th/ 347
METRIC RANK
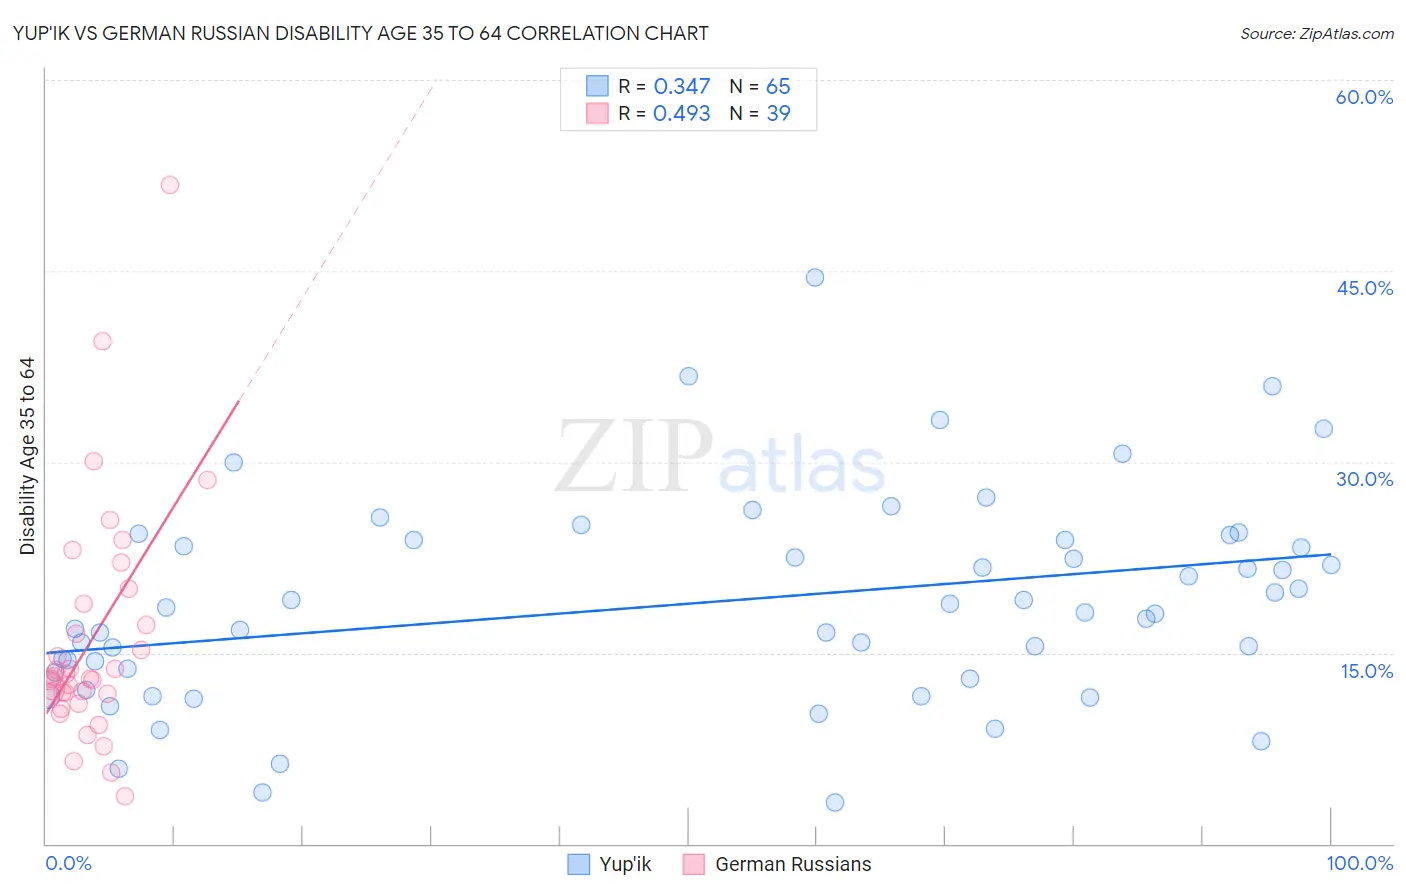
Yup'ik vs German Russian Disability Age 35 to 64 Correlation Chart
The statistical analysis conducted on geographies consisting of 39,958,174 people shows a mild positive correlation between the proportion of Yup'ik and percentage of population with a disability between the ages 34 and 64 in the United States with a correlation coefficient (R) of 0.347 and weighted average of 16.9%. Similarly, the statistical analysis conducted on geographies consisting of 96,440,247 people shows a moderate positive correlation between the proportion of German Russians and percentage of population with a disability between the ages 34 and 64 in the United States with a correlation coefficient (R) of 0.493 and weighted average of 12.5%, a difference of 36.0%.
Disability Age 35 to 64 Correlation Summary
| Measurement | Yup'ik | German Russian |
| Minimum | 3.2% | 3.7% |
| Maximum | 44.4% | 51.7% |
| Range | 41.2% | 48.0% |
| Mean | 18.9% | 16.0% |
| Median | 18.2% | 13.0% |
| Interquartile 25% (IQ1) | 13.2% | 11.8% |
| Interquartile 75% (IQ3) | 23.9% | 18.8% |
| Interquartile Range (IQR) | 10.6% | 7.1% |
| Standard Deviation (Sample) | 8.1% | 9.2% |
| Standard Deviation (Population) | 8.1% | 9.1% |
Similar Demographics by Disability Age 35 to 64
Demographics Similar to Yup'ik by Disability Age 35 to 64
In terms of disability age 35 to 64, the demographic groups most similar to Yup'ik are Creek (16.9%, a difference of 0.32%), Tohono O'odham (16.7%, a difference of 1.2%), Tsimshian (16.7%, a difference of 1.3%), Kiowa (17.4%, a difference of 2.5%), and Choctaw (16.4%, a difference of 3.2%).
| Demographics | Rating | Rank | Disability Age 35 to 64 |
| Yuman | 0.0 /100 | #333 | Tragic 15.8% |
| Colville | 0.0 /100 | #334 | Tragic 15.8% |
| Seminole | 0.0 /100 | #335 | Tragic 15.9% |
| Menominee | 0.0 /100 | #336 | Tragic 15.9% |
| Puerto Ricans | 0.0 /100 | #337 | Tragic 15.9% |
| Chickasaw | 0.0 /100 | #338 | Tragic 16.1% |
| Pima | 0.0 /100 | #339 | Tragic 16.1% |
| Choctaw | 0.0 /100 | #340 | Tragic 16.4% |
| Tsimshian | 0.0 /100 | #341 | Tragic 16.7% |
| Tohono O'odham | 0.0 /100 | #342 | Tragic 16.7% |
| Creek | 0.0 /100 | #343 | Tragic 16.9% |
| Yup'ik | 0.0 /100 | #344 | Tragic 16.9% |
| Kiowa | 0.0 /100 | #345 | Tragic 17.4% |
| Lumbee | 0.0 /100 | #346 | Tragic 17.6% |
| Houma | 0.0 /100 | #347 | Tragic 18.7% |
Demographics Similar to German Russians by Disability Age 35 to 64
In terms of disability age 35 to 64, the demographic groups most similar to German Russians are Malaysian (12.5%, a difference of 0.15%), Senegalese (12.5%, a difference of 0.23%), English (12.4%, a difference of 0.25%), Welsh (12.4%, a difference of 0.37%), and Mexican (12.4%, a difference of 0.46%).
| Demographics | Rating | Rank | Disability Age 35 to 64 |
| Dutch | 1.0 /100 | #253 | Tragic 12.3% |
| Hawaiians | 0.9 /100 | #254 | Tragic 12.3% |
| Japanese | 0.8 /100 | #255 | Tragic 12.3% |
| Scottish | 0.8 /100 | #256 | Tragic 12.4% |
| Mexicans | 0.7 /100 | #257 | Tragic 12.4% |
| Welsh | 0.6 /100 | #258 | Tragic 12.4% |
| English | 0.6 /100 | #259 | Tragic 12.4% |
| German Russians | 0.5 /100 | #260 | Tragic 12.5% |
| Malaysians | 0.5 /100 | #261 | Tragic 12.5% |
| Senegalese | 0.5 /100 | #262 | Tragic 12.5% |
| Immigrants | Zaire | 0.4 /100 | #263 | Tragic 12.5% |
| Immigrants | Portugal | 0.4 /100 | #264 | Tragic 12.5% |
| Marshallese | 0.4 /100 | #265 | Tragic 12.5% |
| Whites/Caucasians | 0.3 /100 | #266 | Tragic 12.6% |
| Sub-Saharan Africans | 0.2 /100 | #267 | Tragic 12.6% |