Yup'ik vs Iroquois Median Male Earnings
COMPARE
Yup'ik
Iroquois
Median Male Earnings
Median Male Earnings Comparison
Yup'ik
Iroquois
$39,504
MEDIAN MALE EARNINGS
0.0/ 100
METRIC RATING
347th/ 347
METRIC RANK
$49,374
MEDIAN MALE EARNINGS
0.7/ 100
METRIC RATING
260th/ 347
METRIC RANK
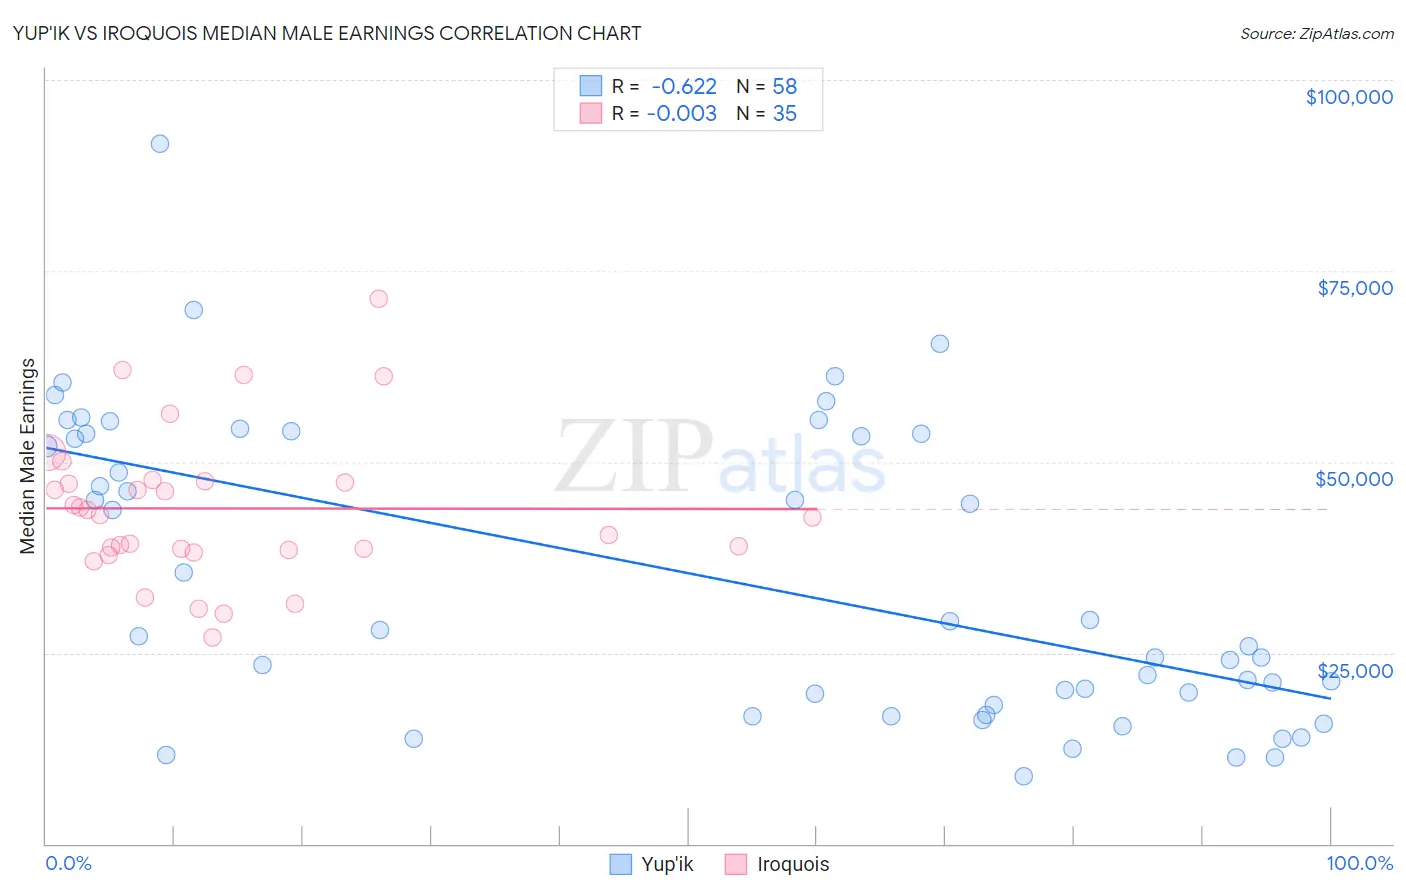
Yup'ik vs Iroquois Median Male Earnings Correlation Chart
The statistical analysis conducted on geographies consisting of 39,949,304 people shows a significant negative correlation between the proportion of Yup'ik and median male earnings in the United States with a correlation coefficient (R) of -0.622 and weighted average of $39,504. Similarly, the statistical analysis conducted on geographies consisting of 207,261,653 people shows no correlation between the proportion of Iroquois and median male earnings in the United States with a correlation coefficient (R) of -0.003 and weighted average of $49,374, a difference of 25.0%.
Median Male Earnings Correlation Summary
| Measurement | Yup'ik | Iroquois |
| Minimum | $8,859 | $26,985 |
| Maximum | $91,667 | $71,281 |
| Range | $82,808 | $44,296 |
| Mean | $35,016 | $43,903 |
| Median | $27,549 | $43,033 |
| Interquartile 25% (IQ1) | $18,125 | $38,514 |
| Interquartile 75% (IQ3) | $53,694 | $47,481 |
| Interquartile Range (IQR) | $35,569 | $8,967 |
| Standard Deviation (Sample) | $19,492 | $9,773 |
| Standard Deviation (Population) | $19,323 | $9,632 |
Similar Demographics by Median Male Earnings
Demographics Similar to Yup'ik by Median Male Earnings
In terms of median male earnings, the demographic groups most similar to Yup'ik are Tohono O'odham ($39,543, a difference of 0.10%), Puerto Rican ($40,071, a difference of 1.4%), Pueblo ($41,314, a difference of 4.6%), Lumbee ($41,715, a difference of 5.6%), and Arapaho ($41,758, a difference of 5.7%).
| Demographics | Rating | Rank | Median Male Earnings |
| Immigrants | Congo | 0.0 /100 | #333 | Tragic $44,204 |
| Immigrants | Yemen | 0.0 /100 | #334 | Tragic $44,083 |
| Spanish American Indians | 0.0 /100 | #335 | Tragic $44,010 |
| Immigrants | Cuba | 0.0 /100 | #336 | Tragic $43,461 |
| Menominee | 0.0 /100 | #337 | Tragic $42,581 |
| Crow | 0.0 /100 | #338 | Tragic $42,434 |
| Pima | 0.0 /100 | #339 | Tragic $42,357 |
| Navajo | 0.0 /100 | #340 | Tragic $42,098 |
| Hopi | 0.0 /100 | #341 | Tragic $42,060 |
| Arapaho | 0.0 /100 | #342 | Tragic $41,758 |
| Lumbee | 0.0 /100 | #343 | Tragic $41,715 |
| Pueblo | 0.0 /100 | #344 | Tragic $41,314 |
| Puerto Ricans | 0.0 /100 | #345 | Tragic $40,071 |
| Tohono O'odham | 0.0 /100 | #346 | Tragic $39,543 |
| Yup'ik | 0.0 /100 | #347 | Tragic $39,504 |
Demographics Similar to Iroquois by Median Male Earnings
In terms of median male earnings, the demographic groups most similar to Iroquois are Liberian ($49,318, a difference of 0.11%), Nepalese ($49,458, a difference of 0.17%), Immigrants from West Indies ($49,271, a difference of 0.21%), Cree ($49,497, a difference of 0.25%), and Nicaraguan ($49,215, a difference of 0.32%).
| Demographics | Rating | Rank | Median Male Earnings |
| German Russians | 1.1 /100 | #253 | Tragic $49,924 |
| Senegalese | 1.0 /100 | #254 | Tragic $49,774 |
| Alaskan Athabascans | 0.9 /100 | #255 | Tragic $49,748 |
| Alaska Natives | 0.9 /100 | #256 | Tragic $49,711 |
| British West Indians | 0.8 /100 | #257 | Tragic $49,636 |
| Cree | 0.7 /100 | #258 | Tragic $49,497 |
| Nepalese | 0.7 /100 | #259 | Tragic $49,458 |
| Iroquois | 0.7 /100 | #260 | Tragic $49,374 |
| Liberians | 0.6 /100 | #261 | Tragic $49,318 |
| Immigrants | West Indies | 0.6 /100 | #262 | Tragic $49,271 |
| Nicaraguans | 0.6 /100 | #263 | Tragic $49,215 |
| Immigrants | Middle Africa | 0.6 /100 | #264 | Tragic $49,201 |
| Immigrants | Laos | 0.6 /100 | #265 | Tragic $49,190 |
| Somalis | 0.5 /100 | #266 | Tragic $49,025 |
| Spanish Americans | 0.5 /100 | #267 | Tragic $49,008 |