Yup'ik vs Immigrants from Northern Europe Disability Age 35 to 64

COMPARE

Yup'ik
Race
Ancestry
AfghanAfricanAlaska NativeAlaskan AthabascanAlbanianAleutAlsatianAmericanApacheArabArapahoArgentineanArmenianAssyrian/Chaldean/SyriacAustralianAustrianBahamianBangladeshiBarbadianBasqueBelgianBelizeanBermudanBhutaneseBlackfeetBolivianBrazilianBritishBritish West IndianBulgarianBurmeseCajunCambodianCanadianCape VerdeanCarpatho RusynCelticCentral AmericanCentral American IndianCherokeeCheyenneChickasawChileanChineseChippewaChoctawColombianColvilleComancheCosta RicanCreeCreekCroatianCrowCubanCypriotCzechCzechoslovakianDanishDelawareDominicanDutchDutch West IndianEastern EuropeanEcuadorianEgyptianEnglishEstonianEthiopianEuropeanFijianFilipinoFinnishFrenchFrench American IndianFrench CanadianGermanGerman RussianGhanaianGreekGuamanian/ChamorroGuatemalanGuyaneseHaitianHmongHonduranHopiHoumaHungarianIcelanderIndian (Asian)IndonesianInupiatIranianIraqiIrishIroquoisIsraeliItalianJamaicanJapaneseJordanianKenyanKiowaKoreanLaotianLatvianLebaneseLiberianLithuanianLumbeeLuxembourgerMacedonianMalaysianMalteseMarshalleseMenomineeMexicanMexican American IndianMongolianMoroccanNative HawaiianNavajoNepaleseNew ZealanderNicaraguanNigerianNorthern EuropeanNorwegianOkinawanOsageOttawaPaiutePakistaniPalestinianPanamanianParaguayanPennsylvania GermanPeruvianPimaPolishPortuguesePotawatomiPuebloPuerto RicanPuget Sound SalishRomanianRussianSalvadoranSamoanScandinavianScotch-IrishScottishSeminoleSenegaleseSerbianShoshoneSierra LeoneanSiouxSlavicSlovakSloveneSomaliSouth AfricanSouth AmericanSouth American IndianSoviet UnionSpaniardSpanishSpanish AmericanSpanish American IndianSri LankanSubsaharan AfricanSudaneseSwedishSwissSyrianTaiwaneseThaiTlingit-HaidaTohono O'OdhamTonganTrinidadian and TobagonianTsimshianTurkishU.S. Virgin IslanderUgandanUkrainianUruguayanUteVenezuelanVietnameseWelshWest IndianYakamaYaquiYugoslavianYumanYup'ikZimbabwean
Immigration
NonimmigrantsImmigrantsAfghanistanAfricaAlbaniaArgentinaArmeniaAsiaAustraliaAustriaBahamasBangladeshBarbadosBelarusBelgiumBelizeBoliviaBosnia and HerzegovinaBrazilBulgariaBurma/MyanmarCabo VerdeCambodiaCameroonCanadaCaribbeanCentral AmericaChileChinaColombiaCongoCosta RicaCroatiaCubaCzechoslovakiaDenmarkDominicaDominican RepublicEastern AfricaEastern AsiaEastern EuropeEcuadorEgyptEl SalvadorEnglandEritreaEthiopiaEuropeFijiFranceGermanyGhanaGreeceGrenadaGuatemalaGuyanaHaitiHondurasHong KongHungaryIndiaIndonesiaIranIraqIrelandIsraelItalyJamaicaJapanJordanKazakhstanKenyaKoreaKuwaitLaosLatin AmericaLatviaLebanonLiberiaLithuaniaMalaysiaMexicoMicronesiaMiddle AfricaMoldovaMoroccoNepalNetherlandsNicaraguaNigeriaNorth AmericaNorth MacedoniaNorthern AfricaNorwayOceaniaPakistanPanamaPeruPhilippinesPolandPortugalRomaniaRussiaSaudi ArabiaScotlandSenegalSerbiaSierra LeoneSingaporeSomaliaSouth AfricaSouth AmericaSouth Central AsiaSouth Eastern AsiaSouthern EuropeSpainSri LankaSt. Vincent and the GrenadinesSudanSwedenSwitzerlandSyriaTaiwanThailandTrinidad and TobagoTurkeyUgandaUkraineUruguayUzbekistanVenezuelaVietnamWest IndiesWestern AfricaWestern AsiaWestern EuropeYemenZaireZimbabweAzores
Immigrants from Northern Europe
Race
Ancestry
AfghanAfricanAlaska NativeAlaskan AthabascanAlbanianAleutAlsatianAmericanApacheArabArapahoArgentineanArmenianAssyrian/Chaldean/SyriacAustralianAustrianBahamianBangladeshiBarbadianBasqueBelgianBelizeanBermudanBhutaneseBlackfeetBolivianBrazilianBritishBritish West IndianBulgarianBurmeseCajunCambodianCanadianCape VerdeanCarpatho RusynCelticCentral AmericanCentral American IndianCherokeeCheyenneChickasawChileanChineseChippewaChoctawColombianColvilleComancheCosta RicanCreeCreekCroatianCrowCubanCypriotCzechCzechoslovakianDanishDelawareDominicanDutchDutch West IndianEastern EuropeanEcuadorianEgyptianEnglishEstonianEthiopianEuropeanFijianFilipinoFinnishFrenchFrench American IndianFrench CanadianGermanGerman RussianGhanaianGreekGuamanian/ChamorroGuatemalanGuyaneseHaitianHmongHonduranHopiHoumaHungarianIcelanderIndian (Asian)IndonesianInupiatIranianIraqiIrishIroquoisIsraeliItalianJamaicanJapaneseJordanianKenyanKiowaKoreanLaotianLatvianLebaneseLiberianLithuanianLumbeeLuxembourgerMacedonianMalaysianMalteseMarshalleseMenomineeMexicanMexican American IndianMongolianMoroccanNative HawaiianNavajoNepaleseNew ZealanderNicaraguanNigerianNorthern EuropeanNorwegianOkinawanOsageOttawaPaiutePakistaniPalestinianPanamanianParaguayanPennsylvania GermanPeruvianPimaPolishPortuguesePotawatomiPuebloPuerto RicanPuget Sound SalishRomanianRussianSalvadoranSamoanScandinavianScotch-IrishScottishSeminoleSenegaleseSerbianShoshoneSierra LeoneanSiouxSlavicSlovakSloveneSomaliSouth AfricanSouth AmericanSouth American IndianSoviet UnionSpaniardSpanishSpanish AmericanSpanish American IndianSri LankanSubsaharan AfricanSudaneseSwedishSwissSyrianTaiwaneseThaiTlingit-HaidaTohono O'OdhamTonganTrinidadian and TobagonianTsimshianTurkishU.S. Virgin IslanderUgandanUkrainianUruguayanUteVenezuelanVietnameseWelshWest IndianYakamaYaquiYugoslavianYumanZimbabwean
Immigration
NonimmigrantsImmigrantsAfghanistanAfricaAlbaniaArgentinaArmeniaAsiaAustraliaAustriaBahamasBangladeshBarbadosBelarusBelgiumBelizeBoliviaBosnia and HerzegovinaBrazilBulgariaBurma/MyanmarCabo VerdeCambodiaCameroonCanadaCaribbeanCentral AmericaChileChinaColombiaCongoCosta RicaCroatiaCubaCzechoslovakiaDenmarkDominicaDominican RepublicEastern AfricaEastern AsiaEastern EuropeEcuadorEgyptEl SalvadorEnglandEritreaEthiopiaEuropeFijiFranceGermanyGhanaGreeceGrenadaGuatemalaGuyanaHaitiHondurasHong KongHungaryIndiaIndonesiaIranIraqIrelandIsraelItalyJamaicaJapanJordanKazakhstanKenyaKoreaKuwaitLaosLatin AmericaLatviaLebanonLiberiaLithuaniaMalaysiaMexicoMicronesiaMiddle AfricaMoldovaMoroccoNepalNetherlandsNicaraguaNigeriaNorth AmericaNorth MacedoniaNorthern AfricaNorthern EuropeNorwayOceaniaPakistanPanamaPeruPhilippinesPolandPortugalRomaniaRussiaSaudi ArabiaScotlandSenegalSerbiaSierra LeoneSingaporeSomaliaSouth AfricaSouth AmericaSouth Central AsiaSouth Eastern AsiaSouthern EuropeSpainSri LankaSt. Vincent and the GrenadinesSudanSwedenSwitzerlandSyriaTaiwanThailandTrinidad and TobagoTurkeyUgandaUkraineUruguayUzbekistanVenezuelaVietnamWest IndiesWestern AfricaWestern AsiaWestern EuropeYemenZaireZimbabweAzores
Disability Age 35 to 64
Income
Poverty
Unemployment
Labor Participation
Family Structure
Vehicle Availability
Education Level
Disability

Disability Age 35 to 64 Comparison

Yup'ik

Immigrants from Northern Europe

Tragic
Exceptional
16.9%
DISABILITY AGE 35 TO 64
0.0/ 100
METRIC RATING
344th/ 347
METRIC RANK
10.1%
DISABILITY AGE 35 TO 64
99.5/ 100
METRIC RATING
72nd/ 347
METRIC RANK

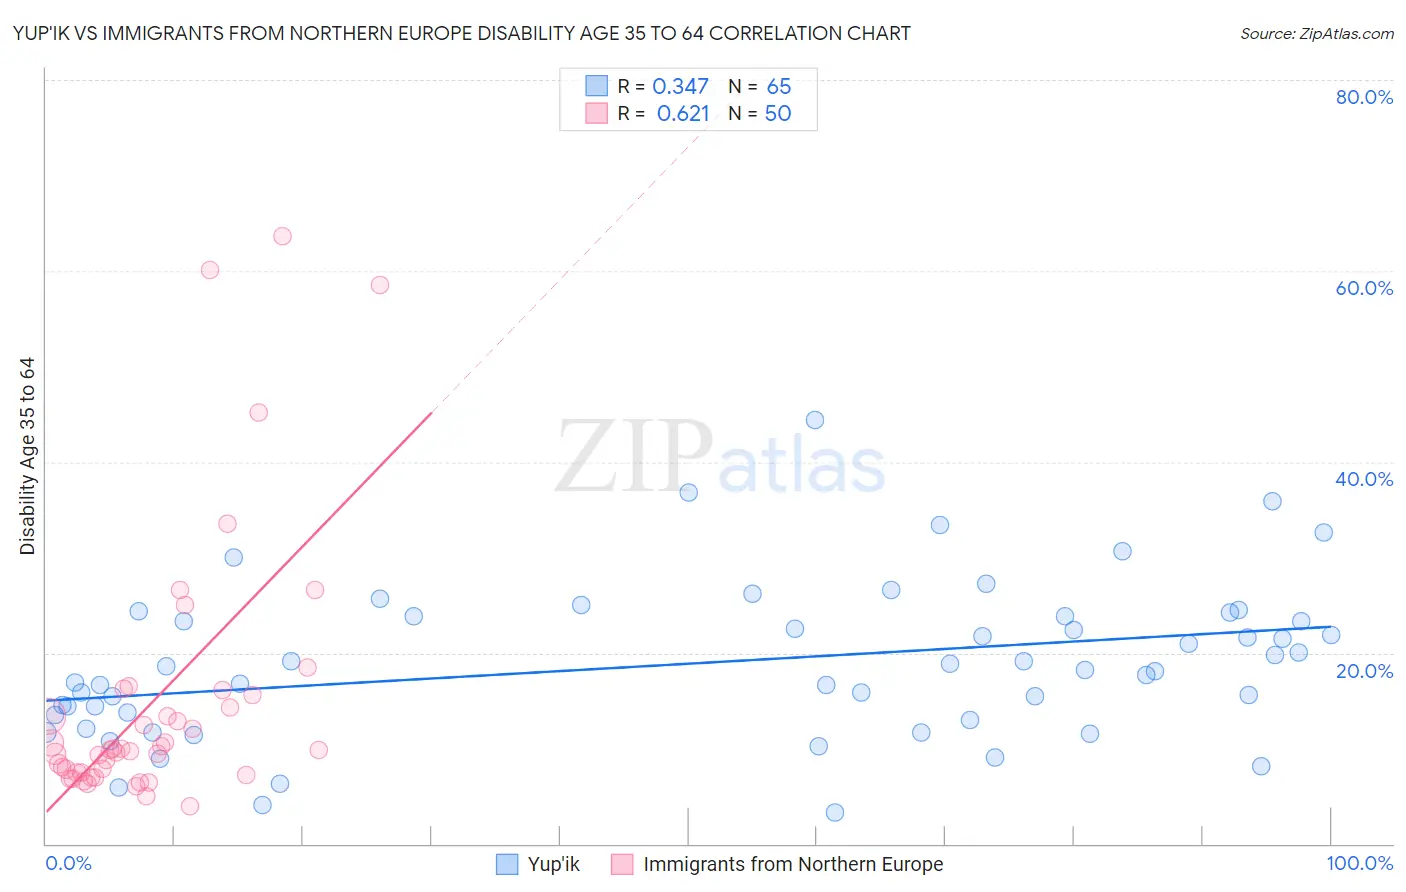
Yup'ik vs Immigrants from Northern Europe Disability Age 35 to 64 Correlation Chart

The statistical analysis conducted on geographies consisting of 39,958,174 people shows a mild positive correlation between the proportion of Yup'ik and percentage of population with a disability between the ages 34 and 64 in the United States with a correlation coefficient (R) of 0.347 and weighted average of 16.9%. Similarly, the statistical analysis conducted on geographies consisting of 476,788,123 people shows a significant positive correlation between the proportion of Immigrants from Northern Europe and percentage of population with a disability between the ages 34 and 64 in the United States with a correlation coefficient (R) of 0.621 and weighted average of 10.1%, a difference of 67.8%.
Yup'ik vs Immigrants from Northern Europe Disability Age 35 to 64

Disability Age 35 to 64 Correlation Summary

MeasurementYup'ikImmigrants from Northern Europe
Minimum3.2%4.0%
Maximum44.4%63.6%
Range41.2%59.7%
Mean18.9%15.0%
Median18.2%9.8%
Interquartile 25% (IQ1)13.2%7.4%
Interquartile 75% (IQ3)23.9%15.6%
Interquartile Range (IQR)10.6%8.2%
Standard Deviation (Sample)8.1%14.0%
Standard Deviation (Population)8.1%13.8%

Similar Demographics by Disability Age 35 to 64

Demographics Similar to Yup'ik by Disability Age 35 to 64

In terms of disability age 35 to 64, the demographic groups most similar to Yup'ik are Creek (16.9%, a difference of 0.32%), Tohono O'odham (16.7%, a difference of 1.2%), Tsimshian (16.7%, a difference of 1.3%), Kiowa (17.4%, a difference of 2.5%), and Choctaw (16.4%, a difference of 3.2%).
DemographicsRating | RankDisability Age 35 to 64
Yuman
0.0
/100
|
#333
Tragic
15.8%
Colville
0.0
/100
|
#334
Tragic
15.8%
Seminole
0.0
/100
|
#335
Tragic
15.9%
Menominee
0.0
/100
|
#336
Tragic
15.9%
Puerto Ricans
0.0
/100
|
#337
Tragic
15.9%
Chickasaw
0.0
/100
|
#338
Tragic
16.1%
Pima
0.0
/100
|
#339
Tragic
16.1%
Choctaw
0.0
/100
|
#340
Tragic
16.4%
Tsimshian
0.0
/100
|
#341
Tragic
16.7%
Tohono O'odham
0.0
/100
|
#342
Tragic
16.7%
Creek
0.0
/100
|
#343
Tragic
16.9%
Yup'ik
0.0
/100
|
#344
Tragic
16.9%
Kiowa
0.0
/100
|
#345
Tragic
17.4%
Lumbee
0.0
/100
|
#346
Tragic
17.6%
Houma
0.0
/100
|
#347
Tragic
18.7%

Demographics Similar to Immigrants from Northern Europe by Disability Age 35 to 64

In terms of disability age 35 to 64, the demographic groups most similar to Immigrants from Northern Europe are Immigrants from France (10.1%, a difference of 0.0%), Laotian (10.1%, a difference of 0.19%), Immigrants from Kazakhstan (10.1%, a difference of 0.20%), Immigrants from Nicaragua (10.1%, a difference of 0.21%), and Immigrants from Eastern Europe (10.1%, a difference of 0.23%).
DemographicsRating | RankDisability Age 35 to 64
Immigrants | Poland
99.6
/100
|
#65
Exceptional
10.0%
Cubans
99.6
/100
|
#66
Exceptional
10.0%
Immigrants | Uzbekistan
99.5
/100
|
#67
Exceptional
10.1%
Immigrants | Switzerland
99.5
/100
|
#68
Exceptional
10.1%
Immigrants | Eastern Europe
99.5
/100
|
#69
Exceptional
10.1%
Immigrants | Nicaragua
99.5
/100
|
#70
Exceptional
10.1%
Immigrants | Kazakhstan
99.5
/100
|
#71
Exceptional
10.1%
Immigrants | Northern Europe
99.5
/100
|
#72
Exceptional
10.1%
Immigrants | France
99.5
/100
|
#73
Exceptional
10.1%
Laotians
99.4
/100
|
#74
Exceptional
10.1%
Immigrants | Latvia
99.4
/100
|
#75
Exceptional
10.1%
Immigrants | Chile
99.4
/100
|
#76
Exceptional
10.1%
Mongolians
99.4
/100
|
#77
Exceptional
10.1%
Jordanians
99.3
/100
|
#78
Exceptional
10.1%
Immigrants | Vietnam
99.3
/100
|
#79
Exceptional
10.1%