Israeli vs Iroquois Disability Age 35 to 64
COMPARE
Israeli
Iroquois
Disability Age 35 to 64
Disability Age 35 to 64 Comparison
Israelis
Iroquois
9.7%
DISABILITY AGE 35 TO 64
99.9/ 100
METRIC RATING
41st/ 347
METRIC RANK
14.4%
DISABILITY AGE 35 TO 64
0.0/ 100
METRIC RATING
313th/ 347
METRIC RANK
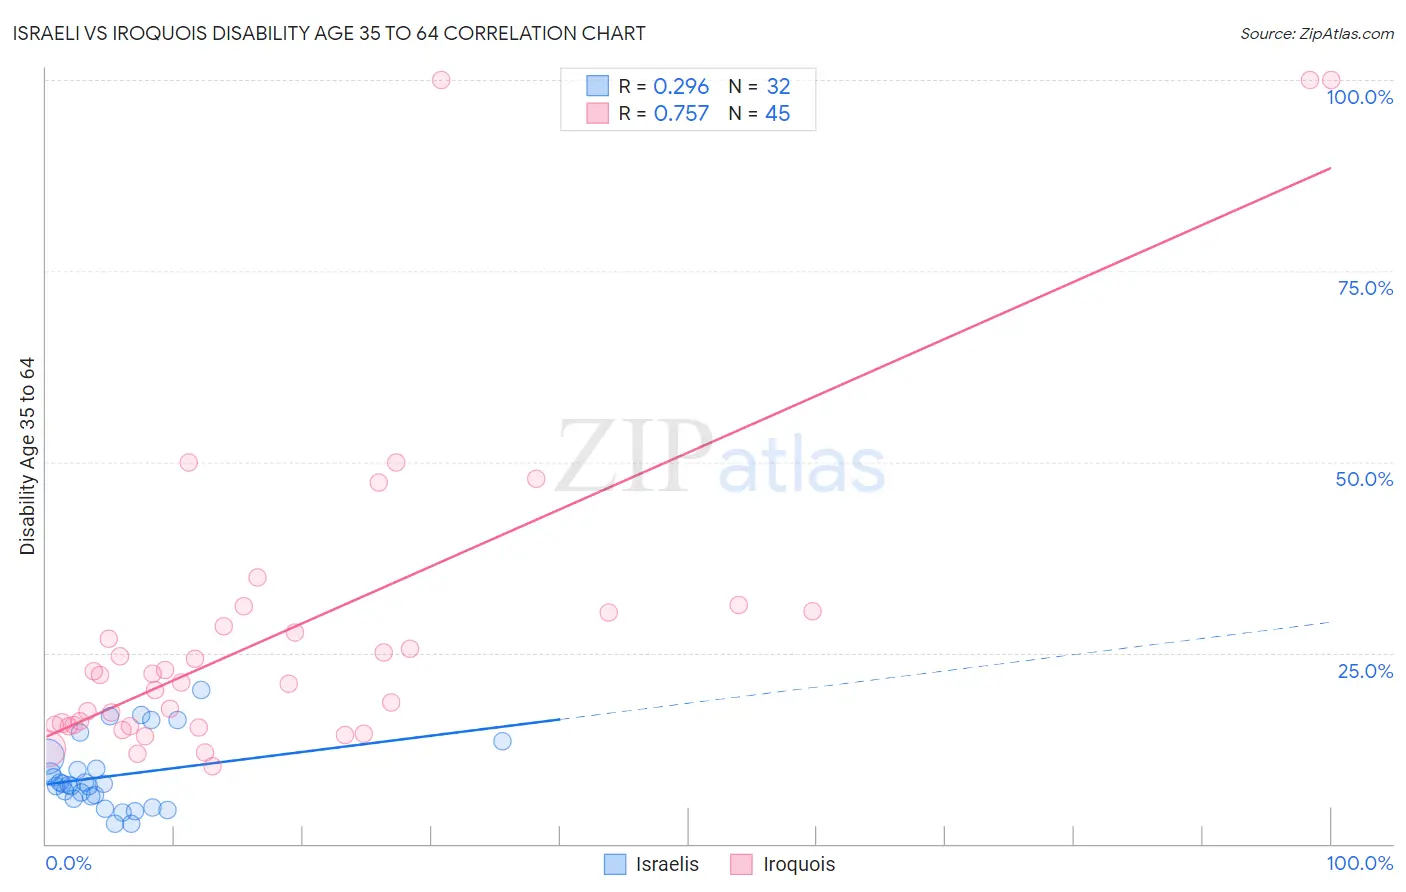
Israeli vs Iroquois Disability Age 35 to 64 Correlation Chart
The statistical analysis conducted on geographies consisting of 210,999,934 people shows a weak positive correlation between the proportion of Israelis and percentage of population with a disability between the ages 34 and 64 in the United States with a correlation coefficient (R) of 0.296 and weighted average of 9.7%. Similarly, the statistical analysis conducted on geographies consisting of 207,235,793 people shows a strong positive correlation between the proportion of Iroquois and percentage of population with a disability between the ages 34 and 64 in the United States with a correlation coefficient (R) of 0.757 and weighted average of 14.4%, a difference of 47.5%.
Disability Age 35 to 64 Correlation Summary
| Measurement | Israeli | Iroquois |
| Minimum | 2.6% | 10.2% |
| Maximum | 20.2% | 100.0% |
| Range | 17.5% | 89.8% |
| Mean | 8.9% | 28.2% |
| Median | 7.7% | 22.1% |
| Interquartile 25% (IQ1) | 6.1% | 15.5% |
| Interquartile 75% (IQ3) | 10.6% | 30.4% |
| Interquartile Range (IQR) | 4.5% | 14.9% |
| Standard Deviation (Sample) | 4.5% | 21.9% |
| Standard Deviation (Population) | 4.5% | 21.6% |
Similar Demographics by Disability Age 35 to 64
Demographics Similar to Israelis by Disability Age 35 to 64
In terms of disability age 35 to 64, the demographic groups most similar to Israelis are Immigrants from Armenia (9.7%, a difference of 0.12%), Immigrants from Belarus (9.7%, a difference of 0.18%), Immigrants from Malaysia (9.7%, a difference of 0.23%), Egyptian (9.7%, a difference of 0.35%), and Immigrants from Colombia (9.8%, a difference of 0.35%).
| Demographics | Rating | Rank | Disability Age 35 to 64 |
| Immigrants | Australia | 99.9 /100 | #34 | Exceptional 9.7% |
| Bulgarians | 99.9 /100 | #35 | Exceptional 9.7% |
| Immigrants | Cuba | 99.9 /100 | #36 | Exceptional 9.7% |
| Immigrants | Turkey | 99.9 /100 | #37 | Exceptional 9.7% |
| Egyptians | 99.9 /100 | #38 | Exceptional 9.7% |
| Immigrants | Belarus | 99.9 /100 | #39 | Exceptional 9.7% |
| Immigrants | Armenia | 99.9 /100 | #40 | Exceptional 9.7% |
| Israelis | 99.9 /100 | #41 | Exceptional 9.7% |
| Immigrants | Malaysia | 99.9 /100 | #42 | Exceptional 9.7% |
| Immigrants | Colombia | 99.9 /100 | #43 | Exceptional 9.8% |
| Immigrants | Egypt | 99.9 /100 | #44 | Exceptional 9.8% |
| Immigrants | Peru | 99.9 /100 | #45 | Exceptional 9.8% |
| Cambodians | 99.8 /100 | #46 | Exceptional 9.8% |
| Immigrants | Belgium | 99.8 /100 | #47 | Exceptional 9.8% |
| Immigrants | Serbia | 99.8 /100 | #48 | Exceptional 9.8% |
Demographics Similar to Iroquois by Disability Age 35 to 64
In terms of disability age 35 to 64, the demographic groups most similar to Iroquois are Paiute (14.3%, a difference of 0.44%), Immigrants from the Azores (14.3%, a difference of 0.58%), Shoshone (14.5%, a difference of 0.76%), Alaska Native (14.5%, a difference of 0.77%), and Osage (14.5%, a difference of 0.97%).
| Demographics | Rating | Rank | Disability Age 35 to 64 |
| Immigrants | Yemen | 0.0 /100 | #306 | Tragic 14.0% |
| Blackfeet | 0.0 /100 | #307 | Tragic 14.1% |
| Inupiat | 0.0 /100 | #308 | Tragic 14.1% |
| Cree | 0.0 /100 | #309 | Tragic 14.1% |
| Cape Verdeans | 0.0 /100 | #310 | Tragic 14.1% |
| Immigrants | Azores | 0.0 /100 | #311 | Tragic 14.3% |
| Paiute | 0.0 /100 | #312 | Tragic 14.3% |
| Iroquois | 0.0 /100 | #313 | Tragic 14.4% |
| Shoshone | 0.0 /100 | #314 | Tragic 14.5% |
| Alaska Natives | 0.0 /100 | #315 | Tragic 14.5% |
| Osage | 0.0 /100 | #316 | Tragic 14.5% |
| Crow | 0.0 /100 | #317 | Tragic 14.6% |
| Ottawa | 0.0 /100 | #318 | Tragic 14.6% |
| Immigrants | Cabo Verde | 0.0 /100 | #319 | Tragic 14.7% |
| Blacks/African Americans | 0.0 /100 | #320 | Tragic 14.7% |