Yup'ik vs Iroquois In Labor Force | Age 16-19
COMPARE
Yup'ik
Iroquois
In Labor Force | Age 16-19
In Labor Force | Age 16-19 Comparison
Yup'ik
Iroquois
33.3%
IN LABOR FORCE | AGE 16-19
0.1/ 100
METRIC RATING
295th/ 347
METRIC RANK
39.9%
IN LABOR FORCE | AGE 16-19
99.9/ 100
METRIC RATING
72nd/ 347
METRIC RANK
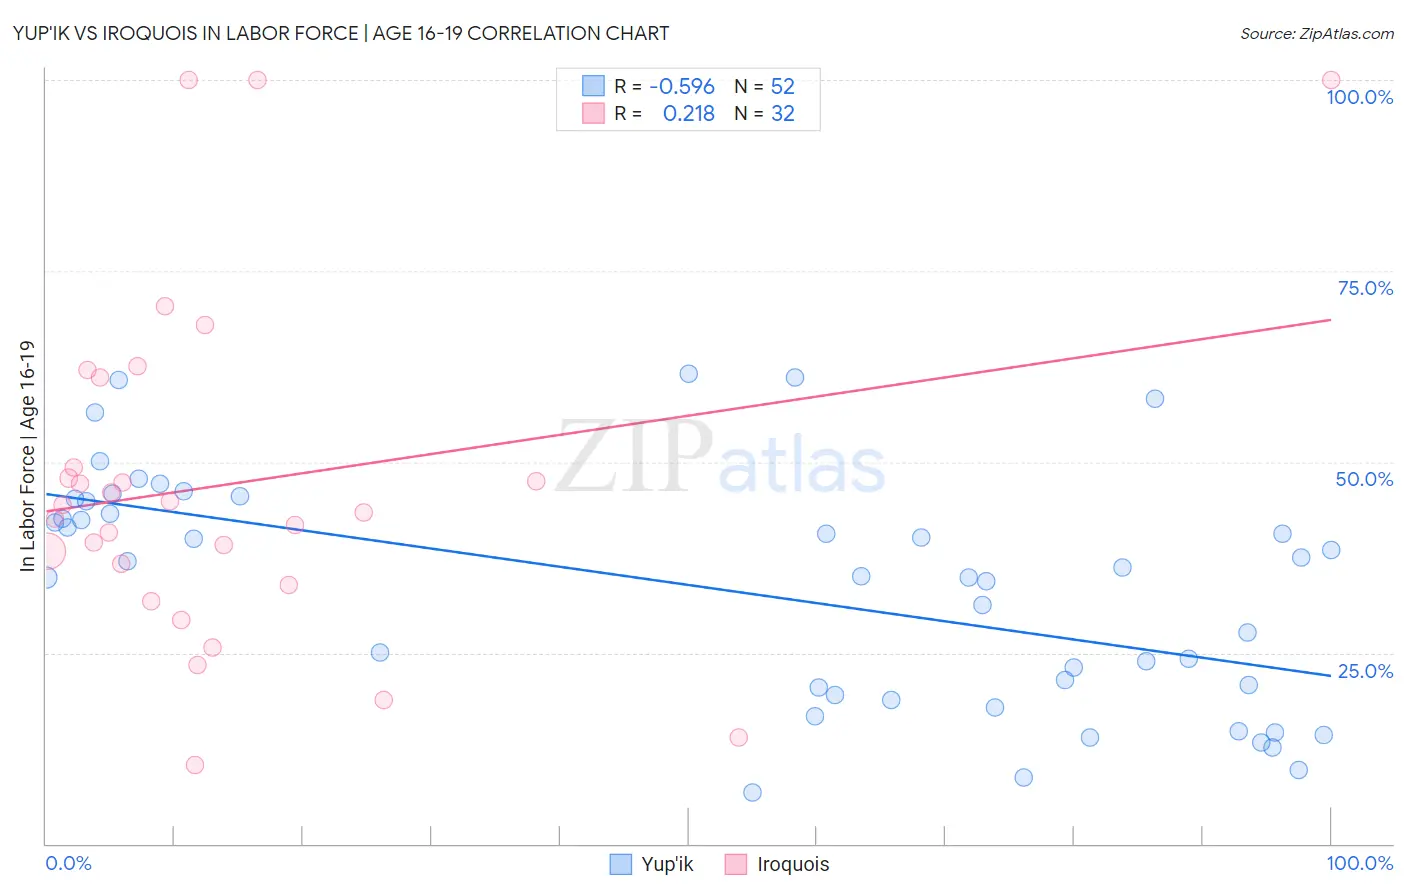
Yup'ik vs Iroquois In Labor Force | Age 16-19 Correlation Chart
The statistical analysis conducted on geographies consisting of 39,923,752 people shows a substantial negative correlation between the proportion of Yup'ik and labor force participation rate among population between the ages 16 and 19 in the United States with a correlation coefficient (R) of -0.596 and weighted average of 33.3%. Similarly, the statistical analysis conducted on geographies consisting of 207,097,008 people shows a weak positive correlation between the proportion of Iroquois and labor force participation rate among population between the ages 16 and 19 in the United States with a correlation coefficient (R) of 0.218 and weighted average of 39.9%, a difference of 20.1%.
In Labor Force | Age 16-19 Correlation Summary
| Measurement | Yup'ik | Iroquois |
| Minimum | 6.7% | 10.4% |
| Maximum | 61.5% | 100.0% |
| Range | 54.8% | 89.6% |
| Mean | 33.3% | 47.1% |
| Median | 35.5% | 43.8% |
| Interquartile 25% (IQ1) | 19.9% | 35.2% |
| Interquartile 75% (IQ3) | 44.0% | 55.2% |
| Interquartile Range (IQR) | 24.1% | 19.9% |
| Standard Deviation (Sample) | 15.0% | 22.3% |
| Standard Deviation (Population) | 14.9% | 22.0% |
Similar Demographics by In Labor Force | Age 16-19
Demographics Similar to Yup'ik by In Labor Force | Age 16-19
In terms of in labor force | age 16-19, the demographic groups most similar to Yup'ik are Argentinean (33.3%, a difference of 0.10%), Immigrants from South America (33.3%, a difference of 0.12%), Jamaican (33.2%, a difference of 0.13%), Immigrants from Haiti (33.2%, a difference of 0.22%), and Haitian (33.4%, a difference of 0.44%).
| Demographics | Rating | Rank | In Labor Force | Age 16-19 |
| Immigrants | Indonesia | 0.1 /100 | #288 | Tragic 33.5% |
| Immigrants | Singapore | 0.1 /100 | #289 | Tragic 33.5% |
| Immigrants | Colombia | 0.1 /100 | #290 | Tragic 33.5% |
| Immigrants | Belarus | 0.1 /100 | #291 | Tragic 33.4% |
| Haitians | 0.1 /100 | #292 | Tragic 33.4% |
| Immigrants | South America | 0.1 /100 | #293 | Tragic 33.3% |
| Argentineans | 0.1 /100 | #294 | Tragic 33.3% |
| Yup'ik | 0.1 /100 | #295 | Tragic 33.3% |
| Jamaicans | 0.1 /100 | #296 | Tragic 33.2% |
| Immigrants | Haiti | 0.1 /100 | #297 | Tragic 33.2% |
| Iranians | 0.0 /100 | #298 | Tragic 33.0% |
| Armenians | 0.0 /100 | #299 | Tragic 32.9% |
| Immigrants | Argentina | 0.0 /100 | #300 | Tragic 32.9% |
| Okinawans | 0.0 /100 | #301 | Tragic 32.8% |
| Belizeans | 0.0 /100 | #302 | Tragic 32.8% |
Demographics Similar to Iroquois by In Labor Force | Age 16-19
In terms of in labor force | age 16-19, the demographic groups most similar to Iroquois are Serbian (39.9%, a difference of 0.010%), Immigrants from Middle Africa (39.9%, a difference of 0.030%), Portuguese (40.0%, a difference of 0.17%), Potawatomi (40.0%, a difference of 0.22%), and Hungarian (39.8%, a difference of 0.26%).
| Demographics | Rating | Rank | In Labor Force | Age 16-19 |
| Kenyans | 100.0 /100 | #65 | Exceptional 40.1% |
| Immigrants | Nonimmigrants | 100.0 /100 | #66 | Exceptional 40.1% |
| Canadians | 100.0 /100 | #67 | Exceptional 40.1% |
| Italians | 99.9 /100 | #68 | Exceptional 40.1% |
| Potawatomi | 99.9 /100 | #69 | Exceptional 40.0% |
| Portuguese | 99.9 /100 | #70 | Exceptional 40.0% |
| Serbians | 99.9 /100 | #71 | Exceptional 39.9% |
| Iroquois | 99.9 /100 | #72 | Exceptional 39.9% |
| Immigrants | Middle Africa | 99.9 /100 | #73 | Exceptional 39.9% |
| Hungarians | 99.9 /100 | #74 | Exceptional 39.8% |
| French American Indians | 99.9 /100 | #75 | Exceptional 39.8% |
| Malaysians | 99.9 /100 | #76 | Exceptional 39.7% |
| Immigrants | Portugal | 99.9 /100 | #77 | Exceptional 39.7% |
| Austrians | 99.8 /100 | #78 | Exceptional 39.5% |
| Marshallese | 99.8 /100 | #79 | Exceptional 39.5% |