Yup'ik vs Immigrants from China Disability Age 65 to 74
COMPARE
Yup'ik
Immigrants from China
Disability Age 65 to 74
Disability Age 65 to 74 Comparison
Yup'ik
Immigrants from China
37.8%
DISABILITY AGE 65 TO 74
0.0/ 100
METRIC RATING
346th/ 347
METRIC RANK
20.3%
DISABILITY AGE 65 TO 74
100.0/ 100
METRIC RATING
9th/ 347
METRIC RANK
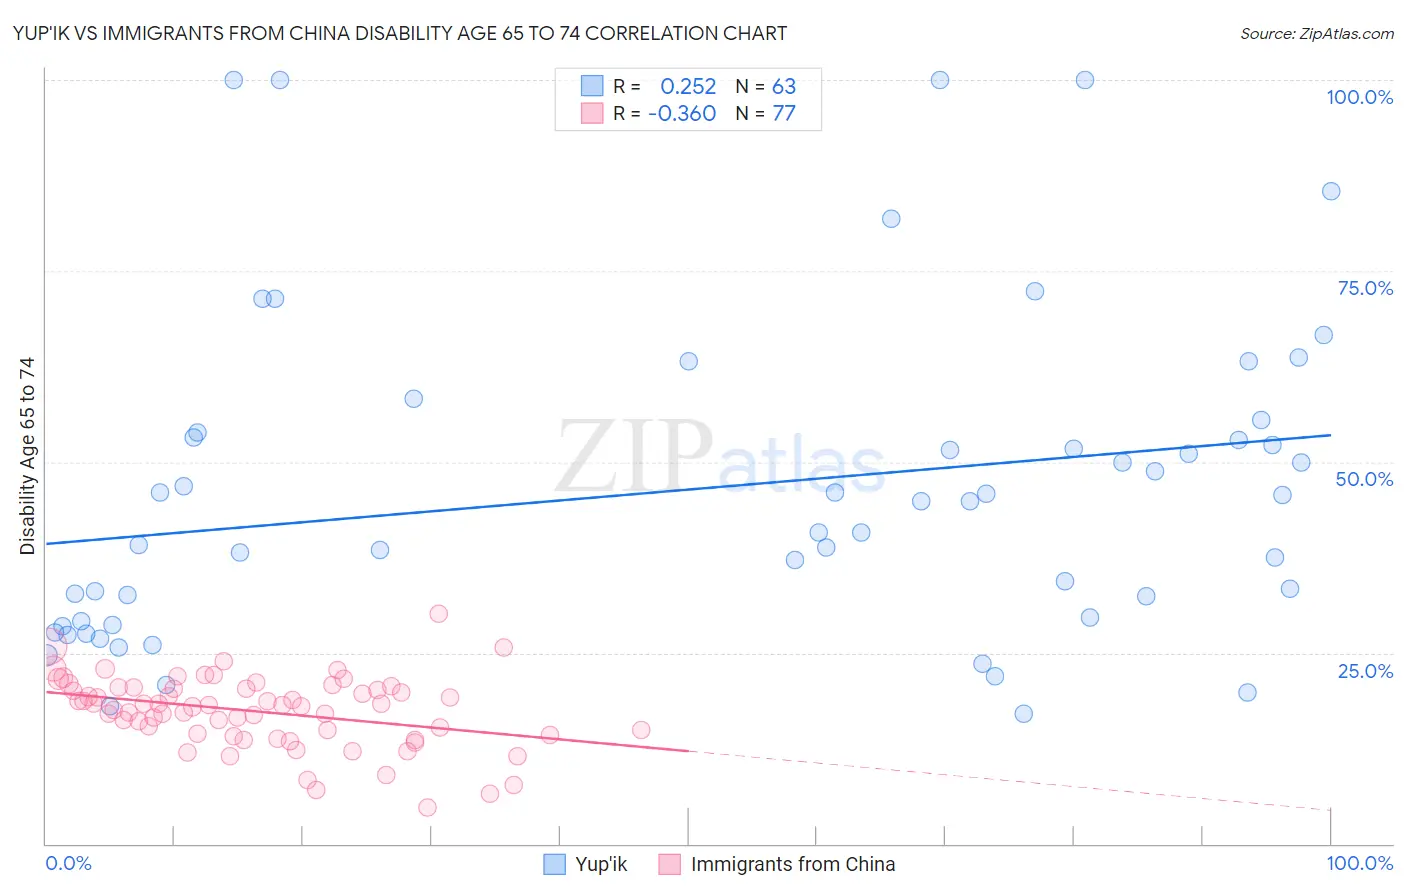
Yup'ik vs Immigrants from China Disability Age 65 to 74 Correlation Chart
The statistical analysis conducted on geographies consisting of 39,932,947 people shows a weak positive correlation between the proportion of Yup'ik and percentage of population with a disability between the ages 65 and 75 in the United States with a correlation coefficient (R) of 0.252 and weighted average of 37.8%. Similarly, the statistical analysis conducted on geographies consisting of 455,755,580 people shows a mild negative correlation between the proportion of Immigrants from China and percentage of population with a disability between the ages 65 and 75 in the United States with a correlation coefficient (R) of -0.360 and weighted average of 20.3%, a difference of 86.7%.
Disability Age 65 to 74 Correlation Summary
| Measurement | Yup'ik | Immigrants from China |
| Minimum | 16.9% | 4.7% |
| Maximum | 100.0% | 30.0% |
| Range | 83.1% | 25.3% |
| Mean | 46.4% | 17.3% |
| Median | 44.8% | 18.2% |
| Interquartile 25% (IQ1) | 29.1% | 14.3% |
| Interquartile 75% (IQ3) | 53.8% | 20.4% |
| Interquartile Range (IQR) | 24.8% | 6.1% |
| Standard Deviation (Sample) | 21.1% | 4.6% |
| Standard Deviation (Population) | 21.0% | 4.6% |
Similar Demographics by Disability Age 65 to 74
Demographics Similar to Yup'ik by Disability Age 65 to 74
In terms of disability age 65 to 74, the demographic groups most similar to Yup'ik are Pima (38.6%, a difference of 2.0%), Tohono O'odham (36.0%, a difference of 5.0%), Inupiat (34.5%, a difference of 9.6%), Navajo (33.3%, a difference of 13.5%), and Pueblo (33.1%, a difference of 14.3%).
| Demographics | Rating | Rank | Disability Age 65 to 74 |
| Colville | 0.0 /100 | #333 | Tragic 30.5% |
| Alaska Natives | 0.0 /100 | #334 | Tragic 30.6% |
| Cheyenne | 0.0 /100 | #335 | Tragic 31.1% |
| Yuman | 0.0 /100 | #336 | Tragic 31.5% |
| Houma | 0.0 /100 | #337 | Tragic 32.3% |
| Alaskan Athabascans | 0.0 /100 | #338 | Tragic 32.4% |
| Kiowa | 0.0 /100 | #339 | Tragic 32.6% |
| Lumbee | 0.0 /100 | #340 | Tragic 32.7% |
| Tsimshian | 0.0 /100 | #341 | Tragic 32.9% |
| Pueblo | 0.0 /100 | #342 | Tragic 33.1% |
| Navajo | 0.0 /100 | #343 | Tragic 33.3% |
| Inupiat | 0.0 /100 | #344 | Tragic 34.5% |
| Tohono O'odham | 0.0 /100 | #345 | Tragic 36.0% |
| Yup'ik | 0.0 /100 | #346 | Tragic 37.8% |
| Pima | 0.0 /100 | #347 | Tragic 38.6% |
Demographics Similar to Immigrants from China by Disability Age 65 to 74
In terms of disability age 65 to 74, the demographic groups most similar to Immigrants from China are Immigrants from Eastern Asia (20.3%, a difference of 0.070%), Immigrants from Ireland (20.3%, a difference of 0.23%), Immigrants from Korea (20.4%, a difference of 0.45%), Immigrants from Singapore (20.4%, a difference of 0.83%), and Thai (20.1%, a difference of 0.96%).
| Demographics | Rating | Rank | Disability Age 65 to 74 |
| Filipinos | 100.0 /100 | #2 | Exceptional 19.0% |
| Immigrants | India | 100.0 /100 | #3 | Exceptional 19.7% |
| Immigrants | Hong Kong | 100.0 /100 | #4 | Exceptional 19.9% |
| Immigrants | Israel | 100.0 /100 | #5 | Exceptional 19.9% |
| Iranians | 100.0 /100 | #6 | Exceptional 19.9% |
| Cypriots | 100.0 /100 | #7 | Exceptional 20.1% |
| Thais | 100.0 /100 | #8 | Exceptional 20.1% |
| Immigrants | China | 100.0 /100 | #9 | Exceptional 20.3% |
| Immigrants | Eastern Asia | 100.0 /100 | #10 | Exceptional 20.3% |
| Immigrants | Ireland | 100.0 /100 | #11 | Exceptional 20.3% |
| Immigrants | Korea | 100.0 /100 | #12 | Exceptional 20.4% |
| Immigrants | Singapore | 100.0 /100 | #13 | Exceptional 20.4% |
| Indians (Asian) | 100.0 /100 | #14 | Exceptional 20.5% |
| Paraguayans | 100.0 /100 | #15 | Exceptional 20.5% |
| Immigrants | Lithuania | 100.0 /100 | #16 | Exceptional 20.5% |