Yup'ik vs Soviet Union Disability Age 65 to 74
COMPARE
Yup'ik
Soviet Union
Disability Age 65 to 74
Disability Age 65 to 74 Comparison
Yup'ik
Soviet Union
37.8%
DISABILITY AGE 65 TO 74
0.0/ 100
METRIC RATING
346th/ 347
METRIC RANK
21.0%
DISABILITY AGE 65 TO 74
99.9/ 100
METRIC RATING
24th/ 347
METRIC RANK
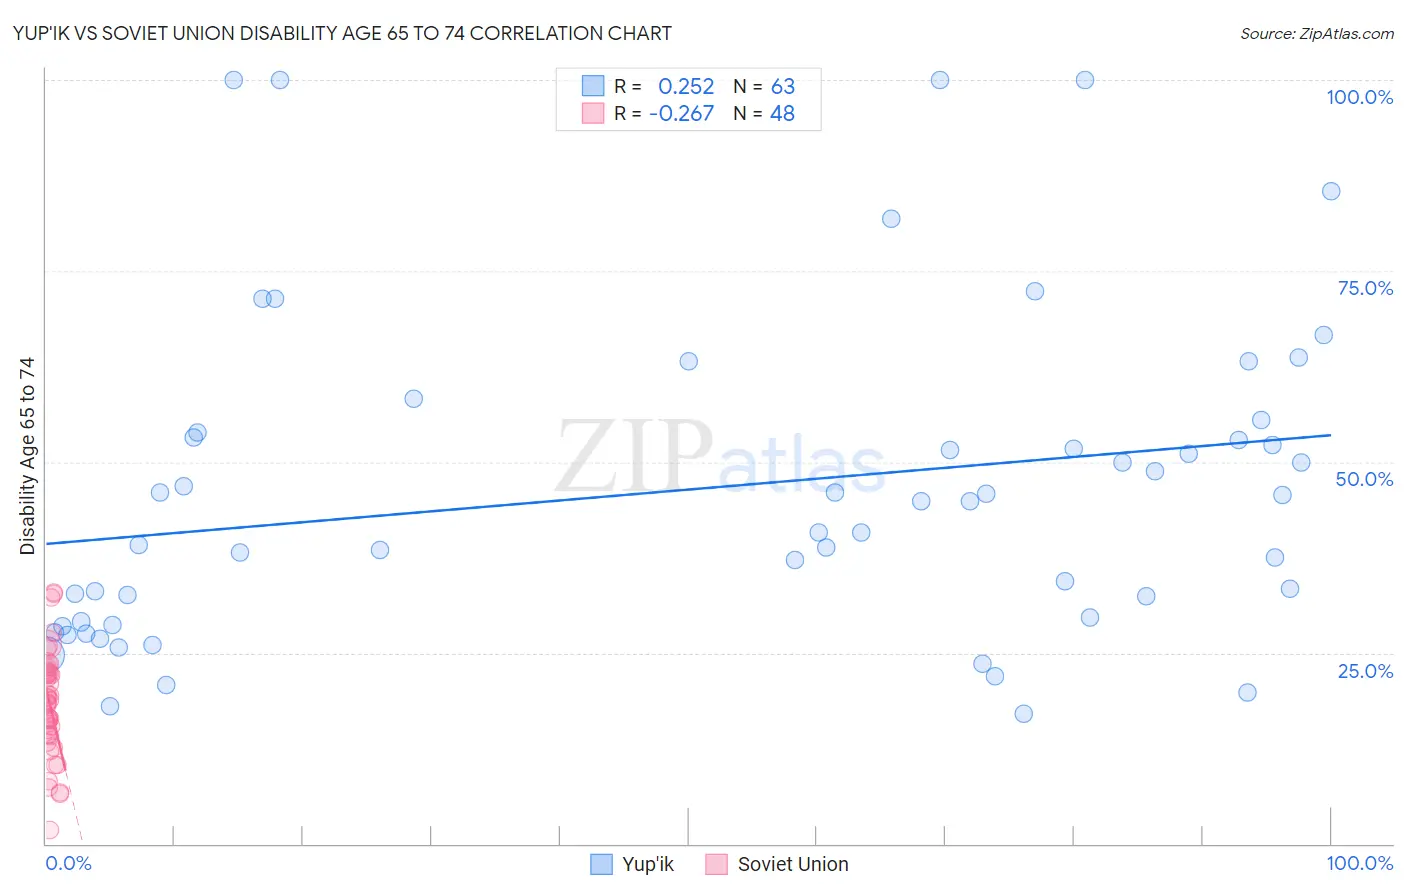
Yup'ik vs Soviet Union Disability Age 65 to 74 Correlation Chart
The statistical analysis conducted on geographies consisting of 39,932,947 people shows a weak positive correlation between the proportion of Yup'ik and percentage of population with a disability between the ages 65 and 75 in the United States with a correlation coefficient (R) of 0.252 and weighted average of 37.8%. Similarly, the statistical analysis conducted on geographies consisting of 43,509,359 people shows a weak negative correlation between the proportion of Soviet Union and percentage of population with a disability between the ages 65 and 75 in the United States with a correlation coefficient (R) of -0.267 and weighted average of 21.0%, a difference of 80.5%.
Disability Age 65 to 74 Correlation Summary
| Measurement | Yup'ik | Soviet Union |
| Minimum | 16.9% | 1.8% |
| Maximum | 100.0% | 32.9% |
| Range | 83.1% | 31.0% |
| Mean | 46.4% | 18.4% |
| Median | 44.8% | 18.7% |
| Interquartile 25% (IQ1) | 29.1% | 14.3% |
| Interquartile 75% (IQ3) | 53.8% | 22.4% |
| Interquartile Range (IQR) | 24.8% | 8.2% |
| Standard Deviation (Sample) | 21.1% | 6.8% |
| Standard Deviation (Population) | 21.0% | 6.7% |
Similar Demographics by Disability Age 65 to 74
Demographics Similar to Yup'ik by Disability Age 65 to 74
In terms of disability age 65 to 74, the demographic groups most similar to Yup'ik are Pima (38.6%, a difference of 2.0%), Tohono O'odham (36.0%, a difference of 5.0%), Inupiat (34.5%, a difference of 9.6%), Navajo (33.3%, a difference of 13.5%), and Pueblo (33.1%, a difference of 14.3%).
| Demographics | Rating | Rank | Disability Age 65 to 74 |
| Colville | 0.0 /100 | #333 | Tragic 30.5% |
| Alaska Natives | 0.0 /100 | #334 | Tragic 30.6% |
| Cheyenne | 0.0 /100 | #335 | Tragic 31.1% |
| Yuman | 0.0 /100 | #336 | Tragic 31.5% |
| Houma | 0.0 /100 | #337 | Tragic 32.3% |
| Alaskan Athabascans | 0.0 /100 | #338 | Tragic 32.4% |
| Kiowa | 0.0 /100 | #339 | Tragic 32.6% |
| Lumbee | 0.0 /100 | #340 | Tragic 32.7% |
| Tsimshian | 0.0 /100 | #341 | Tragic 32.9% |
| Pueblo | 0.0 /100 | #342 | Tragic 33.1% |
| Navajo | 0.0 /100 | #343 | Tragic 33.3% |
| Inupiat | 0.0 /100 | #344 | Tragic 34.5% |
| Tohono O'odham | 0.0 /100 | #345 | Tragic 36.0% |
| Yup'ik | 0.0 /100 | #346 | Tragic 37.8% |
| Pima | 0.0 /100 | #347 | Tragic 38.6% |
Demographics Similar to Soviet Union by Disability Age 65 to 74
In terms of disability age 65 to 74, the demographic groups most similar to Soviet Union are Bolivian (21.0%, a difference of 0.040%), Immigrants from Belgium (21.0%, a difference of 0.050%), Immigrants from Australia (21.0%, a difference of 0.060%), Immigrants from Sweden (21.0%, a difference of 0.080%), and Immigrants from Czechoslovakia (21.0%, a difference of 0.18%).
| Demographics | Rating | Rank | Disability Age 65 to 74 |
| Immigrants | South Central Asia | 100.0 /100 | #17 | Exceptional 20.6% |
| Eastern Europeans | 100.0 /100 | #18 | Exceptional 20.6% |
| Burmese | 100.0 /100 | #19 | Exceptional 20.6% |
| Okinawans | 100.0 /100 | #20 | Exceptional 20.7% |
| Immigrants | Bolivia | 99.9 /100 | #21 | Exceptional 20.8% |
| Immigrants | Iran | 99.9 /100 | #22 | Exceptional 20.9% |
| Immigrants | Belgium | 99.9 /100 | #23 | Exceptional 21.0% |
| Soviet Union | 99.9 /100 | #24 | Exceptional 21.0% |
| Bolivians | 99.9 /100 | #25 | Exceptional 21.0% |
| Immigrants | Australia | 99.9 /100 | #26 | Exceptional 21.0% |
| Immigrants | Sweden | 99.9 /100 | #27 | Exceptional 21.0% |
| Immigrants | Czechoslovakia | 99.9 /100 | #28 | Exceptional 21.0% |
| Immigrants | Japan | 99.9 /100 | #29 | Exceptional 21.0% |
| Immigrants | Greece | 99.9 /100 | #30 | Exceptional 21.0% |
| Immigrants | Northern Europe | 99.9 /100 | #31 | Exceptional 21.0% |