Yup'ik vs Cherokee Disability Age 65 to 74
COMPARE
Yup'ik
Cherokee
Disability Age 65 to 74
Disability Age 65 to 74 Comparison
Yup'ik
Cherokee
37.8%
DISABILITY AGE 65 TO 74
0.0/ 100
METRIC RATING
346th/ 347
METRIC RANK
28.2%
DISABILITY AGE 65 TO 74
0.0/ 100
METRIC RATING
320th/ 347
METRIC RANK
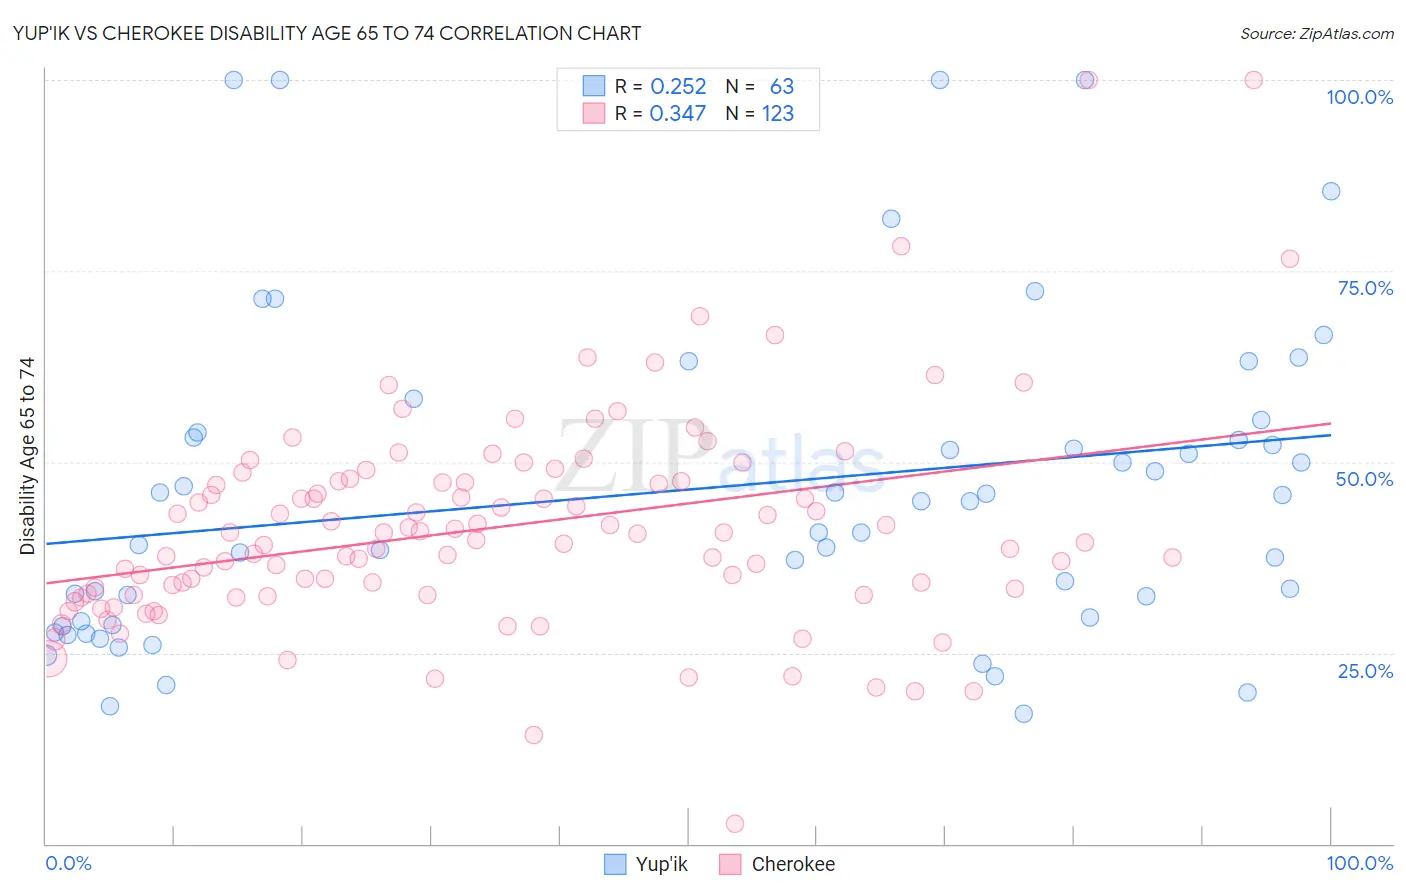
Yup'ik vs Cherokee Disability Age 65 to 74 Correlation Chart
The statistical analysis conducted on geographies consisting of 39,932,947 people shows a weak positive correlation between the proportion of Yup'ik and percentage of population with a disability between the ages 65 and 75 in the United States with a correlation coefficient (R) of 0.252 and weighted average of 37.8%. Similarly, the statistical analysis conducted on geographies consisting of 492,470,212 people shows a mild positive correlation between the proportion of Cherokee and percentage of population with a disability between the ages 65 and 75 in the United States with a correlation coefficient (R) of 0.347 and weighted average of 28.2%, a difference of 34.2%.
Disability Age 65 to 74 Correlation Summary
| Measurement | Yup'ik | Cherokee |
| Minimum | 16.9% | 2.6% |
| Maximum | 100.0% | 100.0% |
| Range | 83.1% | 97.4% |
| Mean | 46.4% | 41.4% |
| Median | 44.8% | 39.7% |
| Interquartile 25% (IQ1) | 29.1% | 32.6% |
| Interquartile 75% (IQ3) | 53.8% | 47.4% |
| Interquartile Range (IQR) | 24.8% | 14.8% |
| Standard Deviation (Sample) | 21.1% | 14.2% |
| Standard Deviation (Population) | 21.0% | 14.1% |
Similar Demographics by Disability Age 65 to 74
Demographics Similar to Yup'ik by Disability Age 65 to 74
In terms of disability age 65 to 74, the demographic groups most similar to Yup'ik are Pima (38.6%, a difference of 2.0%), Tohono O'odham (36.0%, a difference of 5.0%), Inupiat (34.5%, a difference of 9.6%), Navajo (33.3%, a difference of 13.5%), and Pueblo (33.1%, a difference of 14.3%).
| Demographics | Rating | Rank | Disability Age 65 to 74 |
| Colville | 0.0 /100 | #333 | Tragic 30.5% |
| Alaska Natives | 0.0 /100 | #334 | Tragic 30.6% |
| Cheyenne | 0.0 /100 | #335 | Tragic 31.1% |
| Yuman | 0.0 /100 | #336 | Tragic 31.5% |
| Houma | 0.0 /100 | #337 | Tragic 32.3% |
| Alaskan Athabascans | 0.0 /100 | #338 | Tragic 32.4% |
| Kiowa | 0.0 /100 | #339 | Tragic 32.6% |
| Lumbee | 0.0 /100 | #340 | Tragic 32.7% |
| Tsimshian | 0.0 /100 | #341 | Tragic 32.9% |
| Pueblo | 0.0 /100 | #342 | Tragic 33.1% |
| Navajo | 0.0 /100 | #343 | Tragic 33.3% |
| Inupiat | 0.0 /100 | #344 | Tragic 34.5% |
| Tohono O'odham | 0.0 /100 | #345 | Tragic 36.0% |
| Yup'ik | 0.0 /100 | #346 | Tragic 37.8% |
| Pima | 0.0 /100 | #347 | Tragic 38.6% |
Demographics Similar to Cherokee by Disability Age 65 to 74
In terms of disability age 65 to 74, the demographic groups most similar to Cherokee are Arapaho (28.1%, a difference of 0.39%), Comanche (28.3%, a difference of 0.51%), Nepalese (28.0%, a difference of 0.62%), Immigrants from Armenia (28.0%, a difference of 0.84%), and Aleut (28.4%, a difference of 0.84%).
| Demographics | Rating | Rank | Disability Age 65 to 74 |
| Paiute | 0.0 /100 | #313 | Tragic 27.8% |
| Chippewa | 0.0 /100 | #314 | Tragic 27.8% |
| Cajuns | 0.0 /100 | #315 | Tragic 27.9% |
| Crow | 0.0 /100 | #316 | Tragic 27.9% |
| Immigrants | Armenia | 0.0 /100 | #317 | Tragic 28.0% |
| Nepalese | 0.0 /100 | #318 | Tragic 28.0% |
| Arapaho | 0.0 /100 | #319 | Tragic 28.1% |
| Cherokee | 0.0 /100 | #320 | Tragic 28.2% |
| Comanche | 0.0 /100 | #321 | Tragic 28.3% |
| Aleuts | 0.0 /100 | #322 | Tragic 28.4% |
| Puerto Ricans | 0.0 /100 | #323 | Tragic 29.1% |
| Seminole | 0.0 /100 | #324 | Tragic 29.4% |
| Dutch West Indians | 0.0 /100 | #325 | Tragic 29.6% |
| Yakama | 0.0 /100 | #326 | Tragic 29.6% |
| Apache | 0.0 /100 | #327 | Tragic 29.7% |