Immigrants from Switzerland vs Immigrants from China Disability Age 65 to 74
COMPARE
Immigrants from Switzerland
Immigrants from China
Disability Age 65 to 74
Disability Age 65 to 74 Comparison
Immigrants from Switzerland
Immigrants from China
21.1%
DISABILITY AGE 65 TO 74
99.8/ 100
METRIC RATING
36th/ 347
METRIC RANK
20.3%
DISABILITY AGE 65 TO 74
100.0/ 100
METRIC RATING
9th/ 347
METRIC RANK
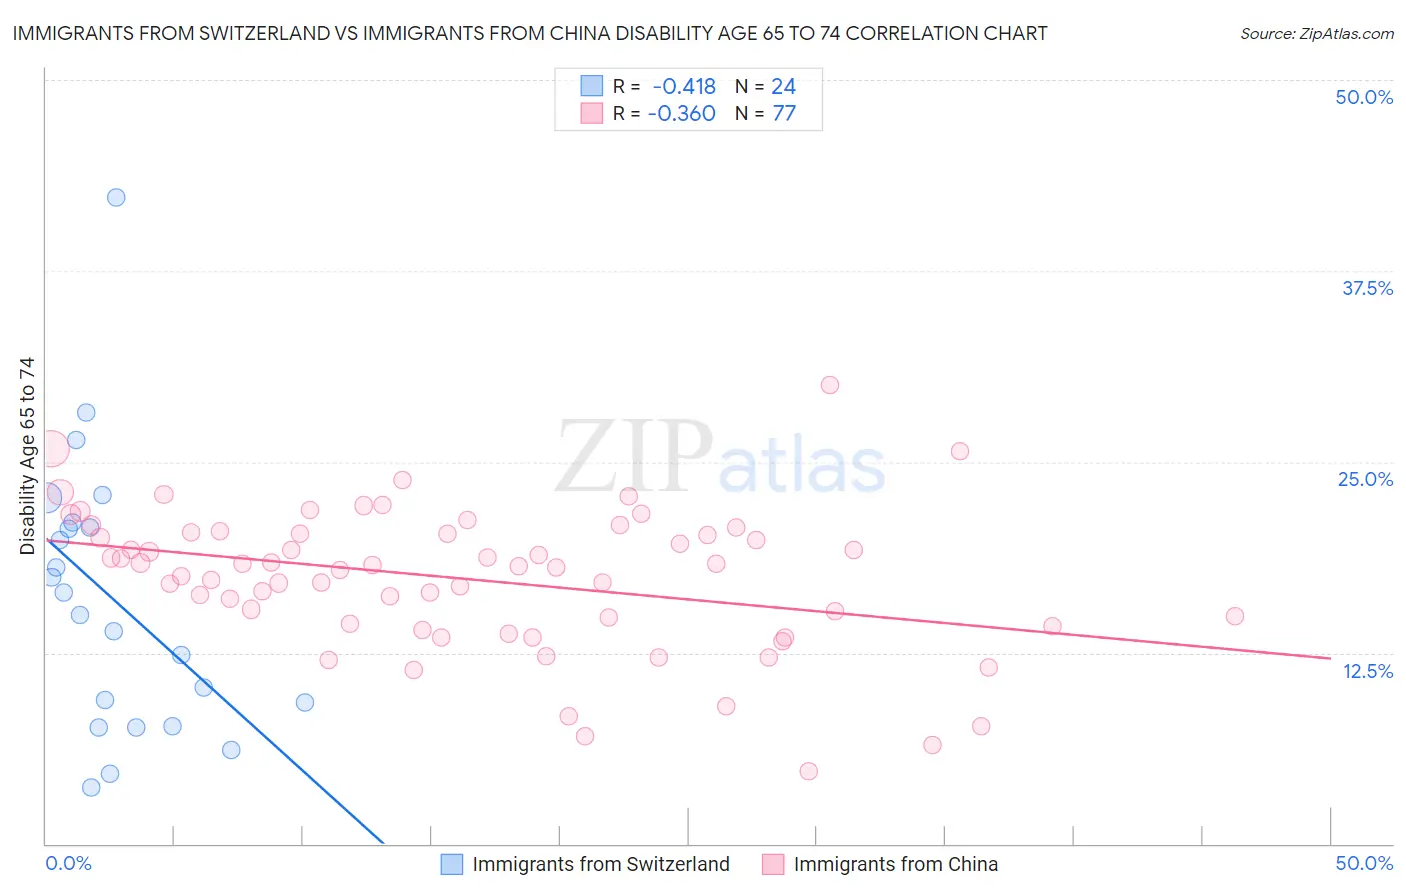
Immigrants from Switzerland vs Immigrants from China Disability Age 65 to 74 Correlation Chart
The statistical analysis conducted on geographies consisting of 147,992,813 people shows a moderate negative correlation between the proportion of Immigrants from Switzerland and percentage of population with a disability between the ages 65 and 75 in the United States with a correlation coefficient (R) of -0.418 and weighted average of 21.1%. Similarly, the statistical analysis conducted on geographies consisting of 455,755,580 people shows a mild negative correlation between the proportion of Immigrants from China and percentage of population with a disability between the ages 65 and 75 in the United States with a correlation coefficient (R) of -0.360 and weighted average of 20.3%, a difference of 4.3%.
Disability Age 65 to 74 Correlation Summary
| Measurement | Immigrants from Switzerland | Immigrants from China |
| Minimum | 3.7% | 4.7% |
| Maximum | 42.3% | 30.0% |
| Range | 38.6% | 25.3% |
| Mean | 16.0% | 17.3% |
| Median | 15.7% | 18.2% |
| Interquartile 25% (IQ1) | 8.5% | 14.3% |
| Interquartile 75% (IQ3) | 20.8% | 20.4% |
| Interquartile Range (IQR) | 12.4% | 6.1% |
| Standard Deviation (Sample) | 9.0% | 4.6% |
| Standard Deviation (Population) | 8.8% | 4.6% |
Similar Demographics by Disability Age 65 to 74
Demographics Similar to Immigrants from Switzerland by Disability Age 65 to 74
In terms of disability age 65 to 74, the demographic groups most similar to Immigrants from Switzerland are Israeli (21.2%, a difference of 0.11%), Russian (21.2%, a difference of 0.11%), Bulgarian (21.1%, a difference of 0.19%), Immigrants from Sri Lanka (21.1%, a difference of 0.25%), and Immigrants from Argentina (21.1%, a difference of 0.28%).
| Demographics | Rating | Rank | Disability Age 65 to 74 |
| Immigrants | Japan | 99.9 /100 | #29 | Exceptional 21.0% |
| Immigrants | Greece | 99.9 /100 | #30 | Exceptional 21.0% |
| Immigrants | Northern Europe | 99.9 /100 | #31 | Exceptional 21.0% |
| Turks | 99.9 /100 | #32 | Exceptional 21.0% |
| Immigrants | Argentina | 99.9 /100 | #33 | Exceptional 21.1% |
| Immigrants | Sri Lanka | 99.9 /100 | #34 | Exceptional 21.1% |
| Bulgarians | 99.9 /100 | #35 | Exceptional 21.1% |
| Immigrants | Switzerland | 99.8 /100 | #36 | Exceptional 21.1% |
| Israelis | 99.8 /100 | #37 | Exceptional 21.2% |
| Russians | 99.8 /100 | #38 | Exceptional 21.2% |
| Argentineans | 99.8 /100 | #39 | Exceptional 21.2% |
| Latvians | 99.8 /100 | #40 | Exceptional 21.2% |
| Immigrants | Austria | 99.8 /100 | #41 | Exceptional 21.2% |
| Macedonians | 99.7 /100 | #42 | Exceptional 21.3% |
| Immigrants | Croatia | 99.7 /100 | #43 | Exceptional 21.3% |
Demographics Similar to Immigrants from China by Disability Age 65 to 74
In terms of disability age 65 to 74, the demographic groups most similar to Immigrants from China are Immigrants from Eastern Asia (20.3%, a difference of 0.070%), Immigrants from Ireland (20.3%, a difference of 0.23%), Immigrants from Korea (20.4%, a difference of 0.45%), Immigrants from Singapore (20.4%, a difference of 0.83%), and Thai (20.1%, a difference of 0.96%).
| Demographics | Rating | Rank | Disability Age 65 to 74 |
| Filipinos | 100.0 /100 | #2 | Exceptional 19.0% |
| Immigrants | India | 100.0 /100 | #3 | Exceptional 19.7% |
| Immigrants | Hong Kong | 100.0 /100 | #4 | Exceptional 19.9% |
| Immigrants | Israel | 100.0 /100 | #5 | Exceptional 19.9% |
| Iranians | 100.0 /100 | #6 | Exceptional 19.9% |
| Cypriots | 100.0 /100 | #7 | Exceptional 20.1% |
| Thais | 100.0 /100 | #8 | Exceptional 20.1% |
| Immigrants | China | 100.0 /100 | #9 | Exceptional 20.3% |
| Immigrants | Eastern Asia | 100.0 /100 | #10 | Exceptional 20.3% |
| Immigrants | Ireland | 100.0 /100 | #11 | Exceptional 20.3% |
| Immigrants | Korea | 100.0 /100 | #12 | Exceptional 20.4% |
| Immigrants | Singapore | 100.0 /100 | #13 | Exceptional 20.4% |
| Indians (Asian) | 100.0 /100 | #14 | Exceptional 20.5% |
| Paraguayans | 100.0 /100 | #15 | Exceptional 20.5% |
| Immigrants | Lithuania | 100.0 /100 | #16 | Exceptional 20.5% |