Yup'ik vs English Disability Age 65 to 74
COMPARE
Yup'ik
English
Disability Age 65 to 74
Disability Age 65 to 74 Comparison
Yup'ik
English
37.8%
DISABILITY AGE 65 TO 74
0.0/ 100
METRIC RATING
346th/ 347
METRIC RANK
23.6%
DISABILITY AGE 65 TO 74
28.5/ 100
METRIC RATING
193rd/ 347
METRIC RANK
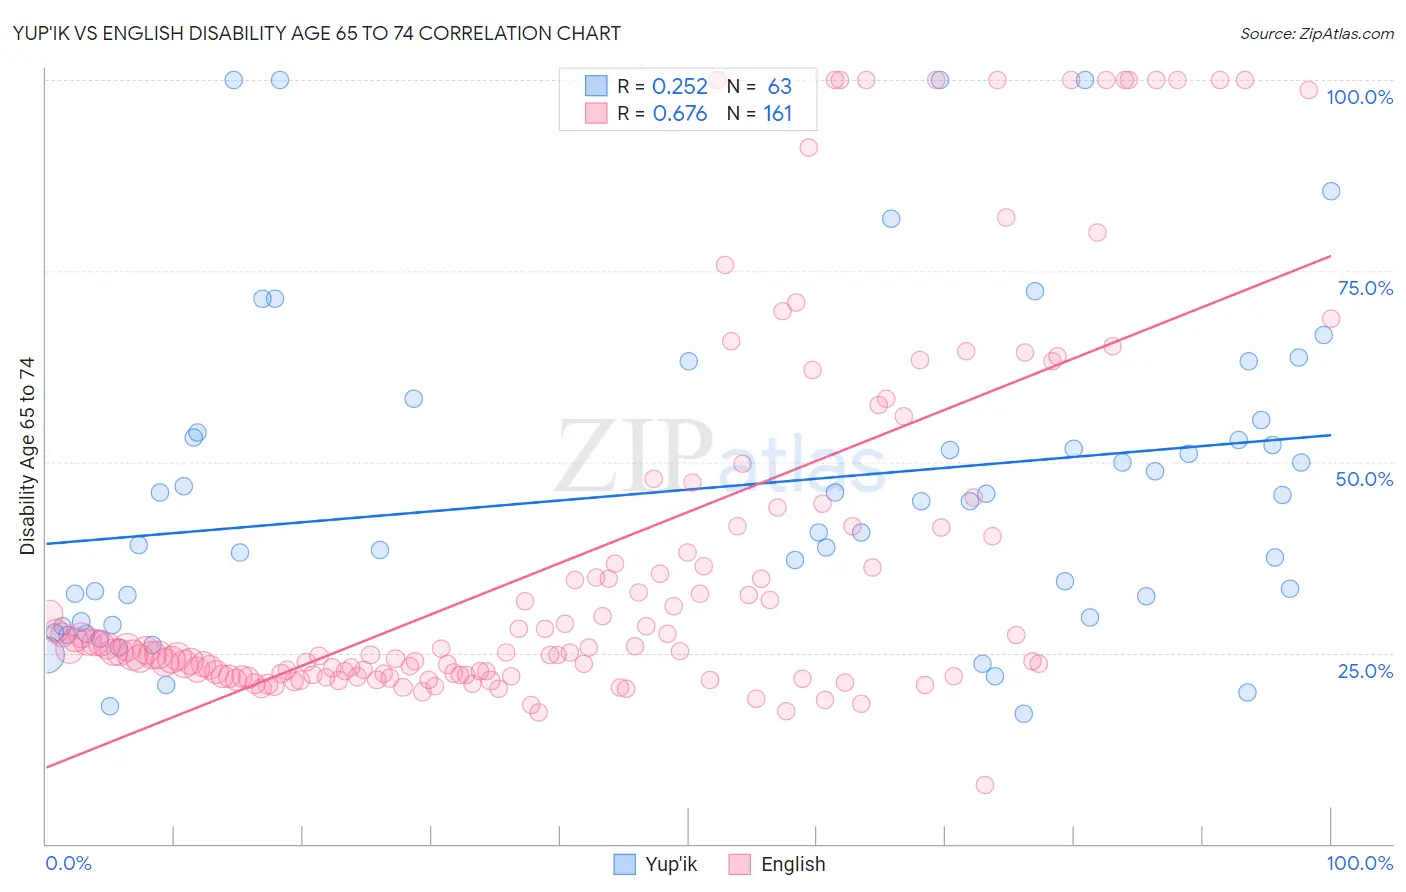
Yup'ik vs English Disability Age 65 to 74 Correlation Chart
The statistical analysis conducted on geographies consisting of 39,932,947 people shows a weak positive correlation between the proportion of Yup'ik and percentage of population with a disability between the ages 65 and 75 in the United States with a correlation coefficient (R) of 0.252 and weighted average of 37.8%. Similarly, the statistical analysis conducted on geographies consisting of 576,788,305 people shows a significant positive correlation between the proportion of English and percentage of population with a disability between the ages 65 and 75 in the United States with a correlation coefficient (R) of 0.676 and weighted average of 23.6%, a difference of 60.0%.
Disability Age 65 to 74 Correlation Summary
| Measurement | Yup'ik | English |
| Minimum | 16.9% | 7.7% |
| Maximum | 100.0% | 100.0% |
| Range | 83.1% | 92.3% |
| Mean | 46.4% | 37.7% |
| Median | 44.8% | 25.2% |
| Interquartile 25% (IQ1) | 29.1% | 22.1% |
| Interquartile 75% (IQ3) | 53.8% | 41.6% |
| Interquartile Range (IQR) | 24.8% | 19.4% |
| Standard Deviation (Sample) | 21.1% | 24.9% |
| Standard Deviation (Population) | 21.0% | 24.8% |
Similar Demographics by Disability Age 65 to 74
Demographics Similar to Yup'ik by Disability Age 65 to 74
In terms of disability age 65 to 74, the demographic groups most similar to Yup'ik are Pima (38.6%, a difference of 2.0%), Tohono O'odham (36.0%, a difference of 5.0%), Inupiat (34.5%, a difference of 9.6%), Navajo (33.3%, a difference of 13.5%), and Pueblo (33.1%, a difference of 14.3%).
| Demographics | Rating | Rank | Disability Age 65 to 74 |
| Colville | 0.0 /100 | #333 | Tragic 30.5% |
| Alaska Natives | 0.0 /100 | #334 | Tragic 30.6% |
| Cheyenne | 0.0 /100 | #335 | Tragic 31.1% |
| Yuman | 0.0 /100 | #336 | Tragic 31.5% |
| Houma | 0.0 /100 | #337 | Tragic 32.3% |
| Alaskan Athabascans | 0.0 /100 | #338 | Tragic 32.4% |
| Kiowa | 0.0 /100 | #339 | Tragic 32.6% |
| Lumbee | 0.0 /100 | #340 | Tragic 32.7% |
| Tsimshian | 0.0 /100 | #341 | Tragic 32.9% |
| Pueblo | 0.0 /100 | #342 | Tragic 33.1% |
| Navajo | 0.0 /100 | #343 | Tragic 33.3% |
| Inupiat | 0.0 /100 | #344 | Tragic 34.5% |
| Tohono O'odham | 0.0 /100 | #345 | Tragic 36.0% |
| Yup'ik | 0.0 /100 | #346 | Tragic 37.8% |
| Pima | 0.0 /100 | #347 | Tragic 38.6% |
Demographics Similar to English by Disability Age 65 to 74
In terms of disability age 65 to 74, the demographic groups most similar to English are Sudanese (23.7%, a difference of 0.050%), Ecuadorian (23.6%, a difference of 0.080%), Immigrants from Bangladesh (23.6%, a difference of 0.12%), Immigrants from St. Vincent and the Grenadines (23.7%, a difference of 0.18%), and Immigrants from Trinidad and Tobago (23.7%, a difference of 0.18%).
| Demographics | Rating | Rank | Disability Age 65 to 74 |
| Basques | 38.4 /100 | #186 | Fair 23.5% |
| Portuguese | 37.8 /100 | #187 | Fair 23.5% |
| Immigrants | Cuba | 34.0 /100 | #188 | Fair 23.6% |
| Scottish | 33.1 /100 | #189 | Fair 23.6% |
| Immigrants | Guyana | 31.2 /100 | #190 | Fair 23.6% |
| Immigrants | Bangladesh | 30.2 /100 | #191 | Fair 23.6% |
| Ecuadorians | 29.7 /100 | #192 | Fair 23.6% |
| English | 28.5 /100 | #193 | Fair 23.6% |
| Sudanese | 27.8 /100 | #194 | Fair 23.7% |
| Immigrants | St. Vincent and the Grenadines | 26.1 /100 | #195 | Fair 23.7% |
| Immigrants | Trinidad and Tobago | 26.1 /100 | #196 | Fair 23.7% |
| Immigrants | Immigrants | 25.8 /100 | #197 | Fair 23.7% |
| Immigrants | Africa | 24.4 /100 | #198 | Fair 23.7% |
| Welsh | 24.3 /100 | #199 | Fair 23.7% |
| French Canadians | 24.0 /100 | #200 | Fair 23.7% |