Yuman vs Puerto Rican Disability Age 65 to 74
COMPARE
Yuman
Puerto Rican
Disability Age 65 to 74
Disability Age 65 to 74 Comparison
Yuman
Puerto Ricans
31.5%
DISABILITY AGE 65 TO 74
0.0/ 100
METRIC RATING
336th/ 347
METRIC RANK
29.1%
DISABILITY AGE 65 TO 74
0.0/ 100
METRIC RATING
323rd/ 347
METRIC RANK
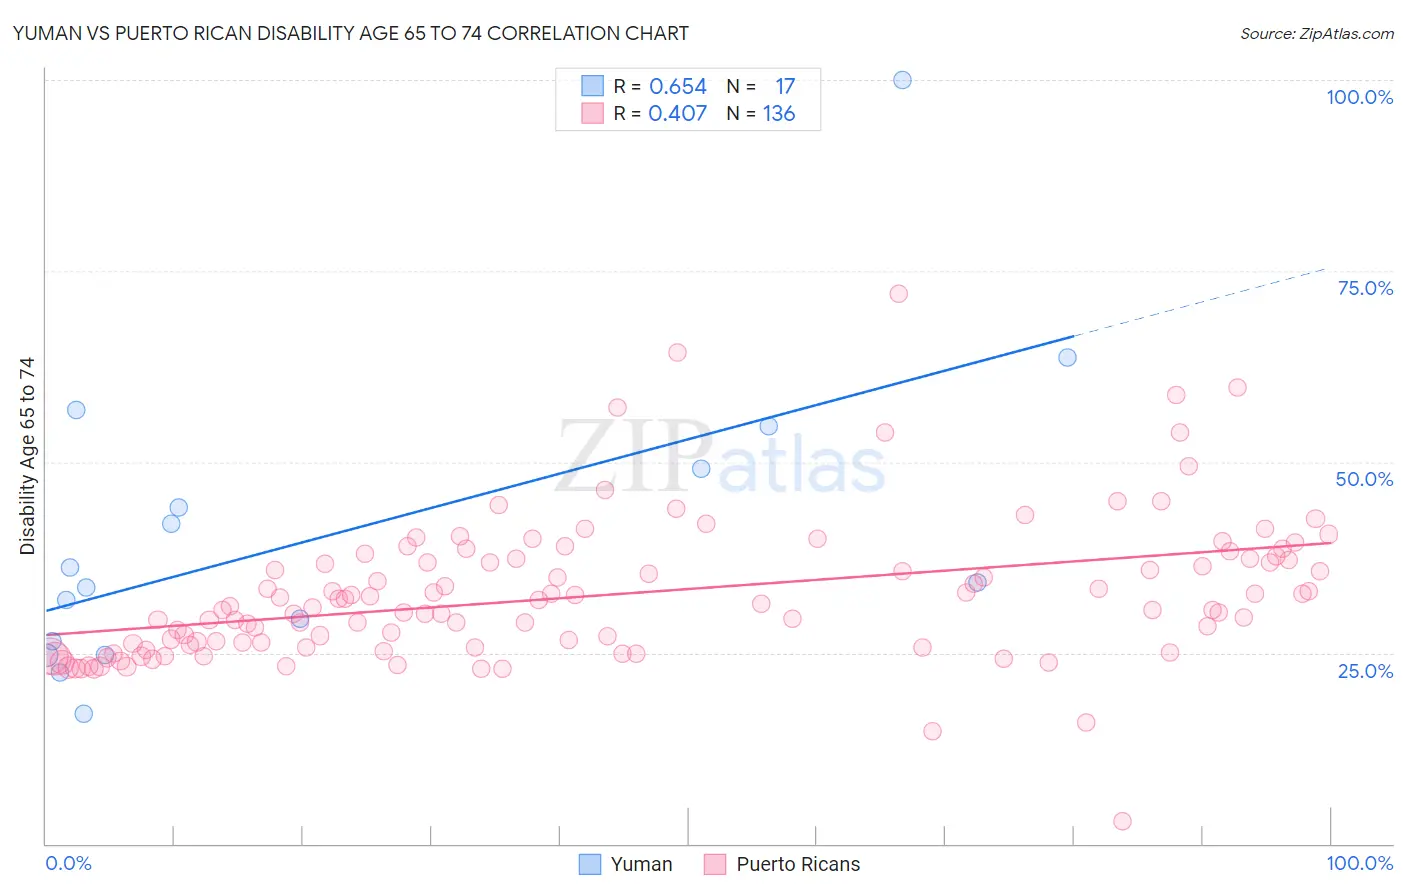
Yuman vs Puerto Rican Disability Age 65 to 74 Correlation Chart
The statistical analysis conducted on geographies consisting of 40,592,488 people shows a significant positive correlation between the proportion of Yuman and percentage of population with a disability between the ages 65 and 75 in the United States with a correlation coefficient (R) of 0.654 and weighted average of 31.5%. Similarly, the statistical analysis conducted on geographies consisting of 526,448,167 people shows a moderate positive correlation between the proportion of Puerto Ricans and percentage of population with a disability between the ages 65 and 75 in the United States with a correlation coefficient (R) of 0.407 and weighted average of 29.1%, a difference of 8.0%.
Disability Age 65 to 74 Correlation Summary
| Measurement | Yuman | Puerto Rican |
| Minimum | 17.1% | 2.9% |
| Maximum | 100.0% | 72.0% |
| Range | 82.9% | 69.1% |
| Mean | 40.6% | 32.6% |
| Median | 34.2% | 31.0% |
| Interquartile 25% (IQ1) | 25.6% | 25.9% |
| Interquartile 75% (IQ3) | 51.9% | 37.2% |
| Interquartile Range (IQR) | 26.3% | 11.3% |
| Standard Deviation (Sample) | 20.2% | 9.5% |
| Standard Deviation (Population) | 19.6% | 9.5% |
Demographics Similar to Yuman and Puerto Ricans by Disability Age 65 to 74
In terms of disability age 65 to 74, the demographic groups most similar to Yuman are Cheyenne (31.1%, a difference of 1.3%), Houma (32.3%, a difference of 2.6%), Alaskan Athabascan (32.4%, a difference of 2.8%), Alaska Native (30.6%, a difference of 2.8%), and Colville (30.5%, a difference of 3.1%). Similarly, the demographic groups most similar to Puerto Ricans are Seminole (29.4%, a difference of 0.97%), Dutch West Indian (29.6%, a difference of 1.4%), Yakama (29.6%, a difference of 1.7%), Apache (29.7%, a difference of 1.8%), and Aleut (28.4%, a difference of 2.5%).
| Demographics | Rating | Rank | Disability Age 65 to 74 |
| Arapaho | 0.0 /100 | #319 | Tragic 28.1% |
| Cherokee | 0.0 /100 | #320 | Tragic 28.2% |
| Comanche | 0.0 /100 | #321 | Tragic 28.3% |
| Aleuts | 0.0 /100 | #322 | Tragic 28.4% |
| Puerto Ricans | 0.0 /100 | #323 | Tragic 29.1% |
| Seminole | 0.0 /100 | #324 | Tragic 29.4% |
| Dutch West Indians | 0.0 /100 | #325 | Tragic 29.6% |
| Yakama | 0.0 /100 | #326 | Tragic 29.6% |
| Apache | 0.0 /100 | #327 | Tragic 29.7% |
| Hopi | 0.0 /100 | #328 | Tragic 30.0% |
| Choctaw | 0.0 /100 | #329 | Tragic 30.2% |
| Creek | 0.0 /100 | #330 | Tragic 30.2% |
| Chickasaw | 0.0 /100 | #331 | Tragic 30.2% |
| Natives/Alaskans | 0.0 /100 | #332 | Tragic 30.4% |
| Colville | 0.0 /100 | #333 | Tragic 30.5% |
| Alaska Natives | 0.0 /100 | #334 | Tragic 30.6% |
| Cheyenne | 0.0 /100 | #335 | Tragic 31.1% |
| Yuman | 0.0 /100 | #336 | Tragic 31.5% |
| Houma | 0.0 /100 | #337 | Tragic 32.3% |
| Alaskan Athabascans | 0.0 /100 | #338 | Tragic 32.4% |
| Kiowa | 0.0 /100 | #339 | Tragic 32.6% |