Yuman vs Hawaiian Disability Age 65 to 74
COMPARE
Yuman
Hawaiian
Disability Age 65 to 74
Disability Age 65 to 74 Comparison
Yuman
Hawaiians
31.5%
DISABILITY AGE 65 TO 74
0.0/ 100
METRIC RATING
336th/ 347
METRIC RANK
25.5%
DISABILITY AGE 65 TO 74
0.2/ 100
METRIC RATING
264th/ 347
METRIC RANK
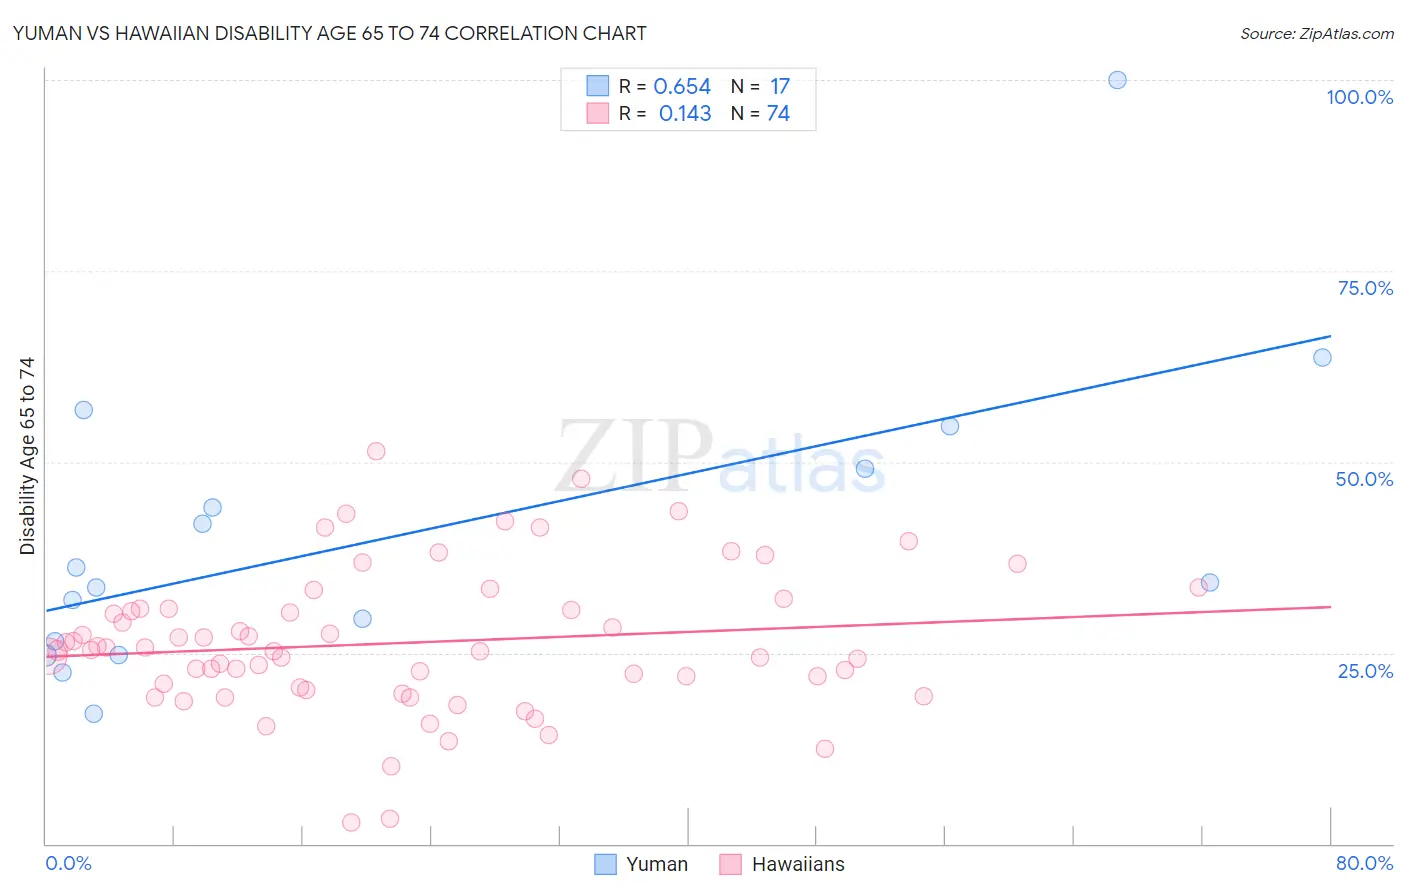
Yuman vs Hawaiian Disability Age 65 to 74 Correlation Chart
The statistical analysis conducted on geographies consisting of 40,592,488 people shows a significant positive correlation between the proportion of Yuman and percentage of population with a disability between the ages 65 and 75 in the United States with a correlation coefficient (R) of 0.654 and weighted average of 31.5%. Similarly, the statistical analysis conducted on geographies consisting of 326,781,274 people shows a poor positive correlation between the proportion of Hawaiians and percentage of population with a disability between the ages 65 and 75 in the United States with a correlation coefficient (R) of 0.143 and weighted average of 25.5%, a difference of 23.3%.
Disability Age 65 to 74 Correlation Summary
| Measurement | Yuman | Hawaiian |
| Minimum | 17.1% | 2.7% |
| Maximum | 100.0% | 51.5% |
| Range | 82.9% | 48.8% |
| Mean | 40.6% | 26.3% |
| Median | 34.2% | 25.4% |
| Interquartile 25% (IQ1) | 25.6% | 20.5% |
| Interquartile 75% (IQ3) | 51.9% | 30.8% |
| Interquartile Range (IQR) | 26.3% | 10.3% |
| Standard Deviation (Sample) | 20.2% | 9.4% |
| Standard Deviation (Population) | 19.6% | 9.3% |
Similar Demographics by Disability Age 65 to 74
Demographics Similar to Yuman by Disability Age 65 to 74
In terms of disability age 65 to 74, the demographic groups most similar to Yuman are Cheyenne (31.1%, a difference of 1.3%), Houma (32.3%, a difference of 2.6%), Alaskan Athabascan (32.4%, a difference of 2.8%), Alaska Native (30.6%, a difference of 2.8%), and Colville (30.5%, a difference of 3.1%).
| Demographics | Rating | Rank | Disability Age 65 to 74 |
| Choctaw | 0.0 /100 | #329 | Tragic 30.2% |
| Creek | 0.0 /100 | #330 | Tragic 30.2% |
| Chickasaw | 0.0 /100 | #331 | Tragic 30.2% |
| Natives/Alaskans | 0.0 /100 | #332 | Tragic 30.4% |
| Colville | 0.0 /100 | #333 | Tragic 30.5% |
| Alaska Natives | 0.0 /100 | #334 | Tragic 30.6% |
| Cheyenne | 0.0 /100 | #335 | Tragic 31.1% |
| Yuman | 0.0 /100 | #336 | Tragic 31.5% |
| Houma | 0.0 /100 | #337 | Tragic 32.3% |
| Alaskan Athabascans | 0.0 /100 | #338 | Tragic 32.4% |
| Kiowa | 0.0 /100 | #339 | Tragic 32.6% |
| Lumbee | 0.0 /100 | #340 | Tragic 32.7% |
| Tsimshian | 0.0 /100 | #341 | Tragic 32.9% |
| Pueblo | 0.0 /100 | #342 | Tragic 33.1% |
| Navajo | 0.0 /100 | #343 | Tragic 33.3% |
Demographics Similar to Hawaiians by Disability Age 65 to 74
In terms of disability age 65 to 74, the demographic groups most similar to Hawaiians are Guatemalan (25.5%, a difference of 0.050%), Immigrants from Latin America (25.6%, a difference of 0.13%), Ottawa (25.6%, a difference of 0.27%), Iroquois (25.4%, a difference of 0.34%), and Samoan (25.4%, a difference of 0.35%).
| Demographics | Rating | Rank | Disability Age 65 to 74 |
| Guamanians/Chamorros | 0.3 /100 | #257 | Tragic 25.3% |
| Marshallese | 0.3 /100 | #258 | Tragic 25.3% |
| Immigrants | Cambodia | 0.3 /100 | #259 | Tragic 25.3% |
| Malaysians | 0.2 /100 | #260 | Tragic 25.4% |
| Cape Verdeans | 0.2 /100 | #261 | Tragic 25.4% |
| Samoans | 0.2 /100 | #262 | Tragic 25.4% |
| Iroquois | 0.2 /100 | #263 | Tragic 25.4% |
| Hawaiians | 0.2 /100 | #264 | Tragic 25.5% |
| Guatemalans | 0.2 /100 | #265 | Tragic 25.5% |
| Immigrants | Latin America | 0.1 /100 | #266 | Tragic 25.6% |
| Ottawa | 0.1 /100 | #267 | Tragic 25.6% |
| Liberians | 0.1 /100 | #268 | Tragic 25.6% |
| Hmong | 0.1 /100 | #269 | Tragic 25.7% |
| Immigrants | Guatemala | 0.1 /100 | #270 | Tragic 25.7% |
| Immigrants | Liberia | 0.1 /100 | #271 | Tragic 25.7% |