Yuman vs Immigrants from Dominican Republic Disability Age 65 to 74
COMPARE
Yuman
Immigrants from Dominican Republic
Disability Age 65 to 74
Disability Age 65 to 74 Comparison
Yuman
Immigrants from Dominican Republic
31.5%
DISABILITY AGE 65 TO 74
0.0/ 100
METRIC RATING
336th/ 347
METRIC RANK
27.0%
DISABILITY AGE 65 TO 74
0.0/ 100
METRIC RATING
300th/ 347
METRIC RANK
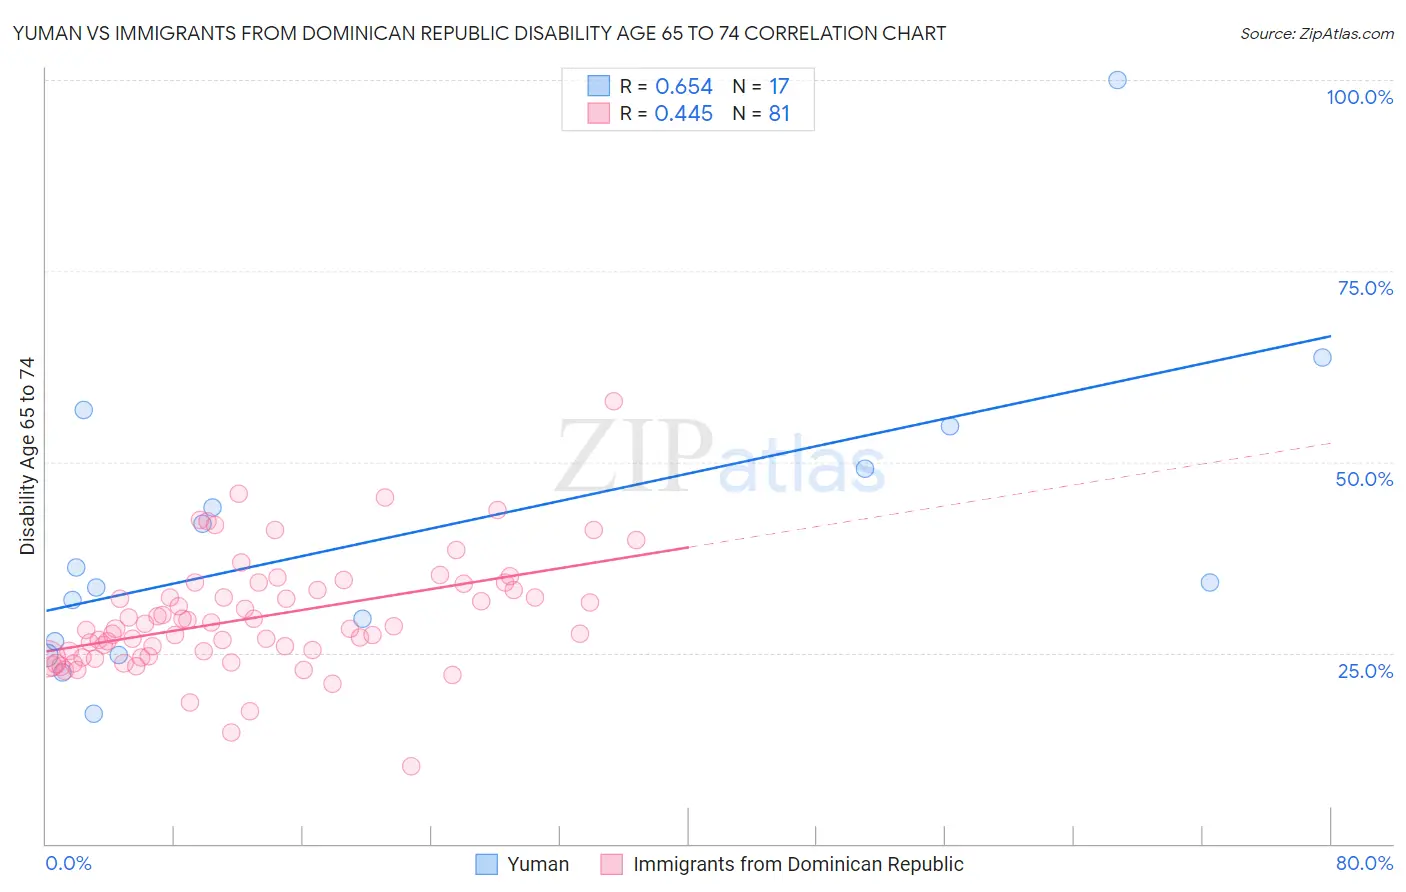
Yuman vs Immigrants from Dominican Republic Disability Age 65 to 74 Correlation Chart
The statistical analysis conducted on geographies consisting of 40,592,488 people shows a significant positive correlation between the proportion of Yuman and percentage of population with a disability between the ages 65 and 75 in the United States with a correlation coefficient (R) of 0.654 and weighted average of 31.5%. Similarly, the statistical analysis conducted on geographies consisting of 274,603,138 people shows a moderate positive correlation between the proportion of Immigrants from Dominican Republic and percentage of population with a disability between the ages 65 and 75 in the United States with a correlation coefficient (R) of 0.445 and weighted average of 27.0%, a difference of 16.5%.
Disability Age 65 to 74 Correlation Summary
| Measurement | Yuman | Immigrants from Dominican Republic |
| Minimum | 17.1% | 10.1% |
| Maximum | 100.0% | 57.9% |
| Range | 82.9% | 47.8% |
| Mean | 40.6% | 29.7% |
| Median | 34.2% | 28.2% |
| Interquartile 25% (IQ1) | 25.6% | 24.5% |
| Interquartile 75% (IQ3) | 51.9% | 33.7% |
| Interquartile Range (IQR) | 26.3% | 9.2% |
| Standard Deviation (Sample) | 20.2% | 7.5% |
| Standard Deviation (Population) | 19.6% | 7.5% |
Similar Demographics by Disability Age 65 to 74
Demographics Similar to Yuman by Disability Age 65 to 74
In terms of disability age 65 to 74, the demographic groups most similar to Yuman are Cheyenne (31.1%, a difference of 1.3%), Houma (32.3%, a difference of 2.6%), Alaskan Athabascan (32.4%, a difference of 2.8%), Alaska Native (30.6%, a difference of 2.8%), and Colville (30.5%, a difference of 3.1%).
| Demographics | Rating | Rank | Disability Age 65 to 74 |
| Choctaw | 0.0 /100 | #329 | Tragic 30.2% |
| Creek | 0.0 /100 | #330 | Tragic 30.2% |
| Chickasaw | 0.0 /100 | #331 | Tragic 30.2% |
| Natives/Alaskans | 0.0 /100 | #332 | Tragic 30.4% |
| Colville | 0.0 /100 | #333 | Tragic 30.5% |
| Alaska Natives | 0.0 /100 | #334 | Tragic 30.6% |
| Cheyenne | 0.0 /100 | #335 | Tragic 31.1% |
| Yuman | 0.0 /100 | #336 | Tragic 31.5% |
| Houma | 0.0 /100 | #337 | Tragic 32.3% |
| Alaskan Athabascans | 0.0 /100 | #338 | Tragic 32.4% |
| Kiowa | 0.0 /100 | #339 | Tragic 32.6% |
| Lumbee | 0.0 /100 | #340 | Tragic 32.7% |
| Tsimshian | 0.0 /100 | #341 | Tragic 32.9% |
| Pueblo | 0.0 /100 | #342 | Tragic 33.1% |
| Navajo | 0.0 /100 | #343 | Tragic 33.3% |
Demographics Similar to Immigrants from Dominican Republic by Disability Age 65 to 74
In terms of disability age 65 to 74, the demographic groups most similar to Immigrants from Dominican Republic are Potawatomi (27.0%, a difference of 0.030%), Immigrants from Yemen (27.0%, a difference of 0.060%), Fijian (27.0%, a difference of 0.080%), Immigrants from Mexico (27.1%, a difference of 0.32%), and Central American Indian (27.1%, a difference of 0.33%).
| Demographics | Rating | Rank | Disability Age 65 to 74 |
| Immigrants | Central America | 0.0 /100 | #293 | Tragic 26.6% |
| Dominicans | 0.0 /100 | #294 | Tragic 26.7% |
| Hispanics or Latinos | 0.0 /100 | #295 | Tragic 26.7% |
| Bangladeshis | 0.0 /100 | #296 | Tragic 26.8% |
| Fijians | 0.0 /100 | #297 | Tragic 27.0% |
| Immigrants | Yemen | 0.0 /100 | #298 | Tragic 27.0% |
| Potawatomi | 0.0 /100 | #299 | Tragic 27.0% |
| Immigrants | Dominican Republic | 0.0 /100 | #300 | Tragic 27.0% |
| Immigrants | Mexico | 0.0 /100 | #301 | Tragic 27.1% |
| Central American Indians | 0.0 /100 | #302 | Tragic 27.1% |
| Tlingit-Haida | 0.0 /100 | #303 | Tragic 27.1% |
| Puget Sound Salish | 0.0 /100 | #304 | Tragic 27.2% |
| Mexicans | 0.0 /100 | #305 | Tragic 27.2% |
| Blacks/African Americans | 0.0 /100 | #306 | Tragic 27.3% |
| Ute | 0.0 /100 | #307 | Tragic 27.3% |