Immigrants from Costa Rica vs Immigrants from Dominican Republic Disability Age 65 to 74
COMPARE
Immigrants from Costa Rica
Immigrants from Dominican Republic
Disability Age 65 to 74
Disability Age 65 to 74 Comparison
Immigrants from Costa Rica
Immigrants from Dominican Republic
22.6%
DISABILITY AGE 65 TO 74
90.4/ 100
METRIC RATING
128th/ 347
METRIC RANK
27.0%
DISABILITY AGE 65 TO 74
0.0/ 100
METRIC RATING
300th/ 347
METRIC RANK
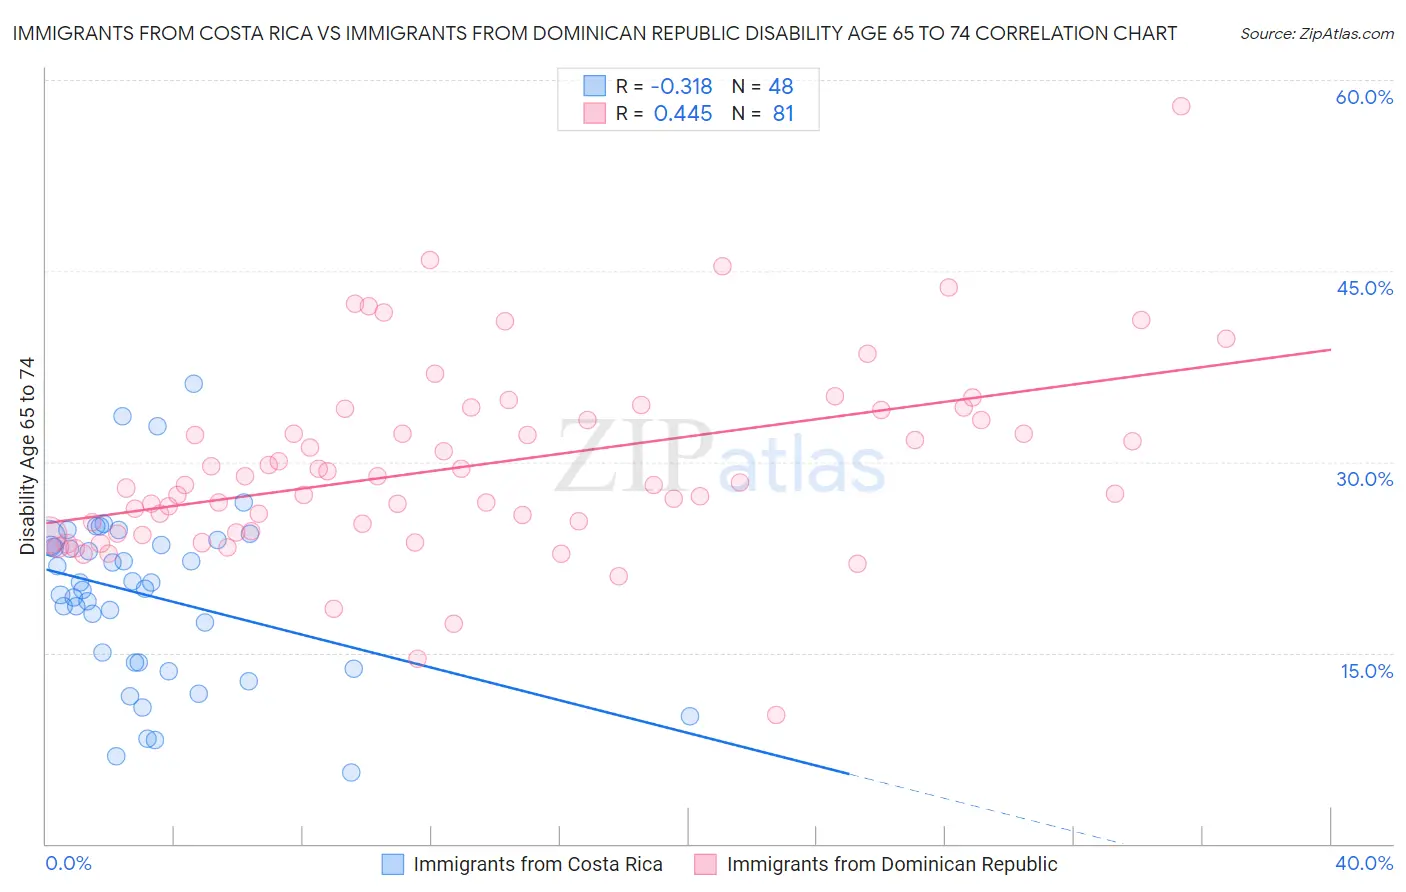
Immigrants from Costa Rica vs Immigrants from Dominican Republic Disability Age 65 to 74 Correlation Chart
The statistical analysis conducted on geographies consisting of 204,181,573 people shows a mild negative correlation between the proportion of Immigrants from Costa Rica and percentage of population with a disability between the ages 65 and 75 in the United States with a correlation coefficient (R) of -0.318 and weighted average of 22.6%. Similarly, the statistical analysis conducted on geographies consisting of 274,603,138 people shows a moderate positive correlation between the proportion of Immigrants from Dominican Republic and percentage of population with a disability between the ages 65 and 75 in the United States with a correlation coefficient (R) of 0.445 and weighted average of 27.0%, a difference of 19.7%.
Disability Age 65 to 74 Correlation Summary
| Measurement | Immigrants from Costa Rica | Immigrants from Dominican Republic |
| Minimum | 5.6% | 10.1% |
| Maximum | 36.1% | 57.9% |
| Range | 30.5% | 47.8% |
| Mean | 19.5% | 29.7% |
| Median | 20.2% | 28.2% |
| Interquartile 25% (IQ1) | 14.3% | 24.5% |
| Interquartile 75% (IQ3) | 23.7% | 33.7% |
| Interquartile Range (IQR) | 9.4% | 9.2% |
| Standard Deviation (Sample) | 6.7% | 7.5% |
| Standard Deviation (Population) | 6.6% | 7.5% |
Similar Demographics by Disability Age 65 to 74
Demographics Similar to Immigrants from Costa Rica by Disability Age 65 to 74
In terms of disability age 65 to 74, the demographic groups most similar to Immigrants from Costa Rica are Immigrants from Uruguay (22.6%, a difference of 0.060%), Immigrants from Albania (22.6%, a difference of 0.070%), Immigrants from Nepal (22.6%, a difference of 0.16%), Costa Rican (22.6%, a difference of 0.19%), and Slovak (22.5%, a difference of 0.23%).
| Demographics | Rating | Rank | Disability Age 65 to 74 |
| Czechs | 93.5 /100 | #121 | Exceptional 22.4% |
| Immigrants | Jordan | 93.5 /100 | #122 | Exceptional 22.4% |
| Hungarians | 93.3 /100 | #123 | Exceptional 22.4% |
| Norwegians | 92.5 /100 | #124 | Exceptional 22.5% |
| Immigrants | Western Europe | 92.3 /100 | #125 | Exceptional 22.5% |
| Lebanese | 92.2 /100 | #126 | Exceptional 22.5% |
| Slovaks | 91.6 /100 | #127 | Exceptional 22.5% |
| Immigrants | Costa Rica | 90.4 /100 | #128 | Exceptional 22.6% |
| Immigrants | Uruguay | 90.1 /100 | #129 | Exceptional 22.6% |
| Immigrants | Albania | 90.0 /100 | #130 | Excellent 22.6% |
| Immigrants | Nepal | 89.4 /100 | #131 | Excellent 22.6% |
| Costa Ricans | 89.2 /100 | #132 | Excellent 22.6% |
| Northern Europeans | 88.9 /100 | #133 | Excellent 22.6% |
| Afghans | 88.6 /100 | #134 | Excellent 22.6% |
| Immigrants | Ukraine | 88.4 /100 | #135 | Excellent 22.6% |
Demographics Similar to Immigrants from Dominican Republic by Disability Age 65 to 74
In terms of disability age 65 to 74, the demographic groups most similar to Immigrants from Dominican Republic are Potawatomi (27.0%, a difference of 0.030%), Immigrants from Yemen (27.0%, a difference of 0.060%), Fijian (27.0%, a difference of 0.080%), Immigrants from Mexico (27.1%, a difference of 0.32%), and Central American Indian (27.1%, a difference of 0.33%).
| Demographics | Rating | Rank | Disability Age 65 to 74 |
| Immigrants | Central America | 0.0 /100 | #293 | Tragic 26.6% |
| Dominicans | 0.0 /100 | #294 | Tragic 26.7% |
| Hispanics or Latinos | 0.0 /100 | #295 | Tragic 26.7% |
| Bangladeshis | 0.0 /100 | #296 | Tragic 26.8% |
| Fijians | 0.0 /100 | #297 | Tragic 27.0% |
| Immigrants | Yemen | 0.0 /100 | #298 | Tragic 27.0% |
| Potawatomi | 0.0 /100 | #299 | Tragic 27.0% |
| Immigrants | Dominican Republic | 0.0 /100 | #300 | Tragic 27.0% |
| Immigrants | Mexico | 0.0 /100 | #301 | Tragic 27.1% |
| Central American Indians | 0.0 /100 | #302 | Tragic 27.1% |
| Tlingit-Haida | 0.0 /100 | #303 | Tragic 27.1% |
| Puget Sound Salish | 0.0 /100 | #304 | Tragic 27.2% |
| Mexicans | 0.0 /100 | #305 | Tragic 27.2% |
| Blacks/African Americans | 0.0 /100 | #306 | Tragic 27.3% |
| Ute | 0.0 /100 | #307 | Tragic 27.3% |