Crow vs Immigrants from Dominican Republic Disability Age 65 to 74
COMPARE
Crow
Immigrants from Dominican Republic
Disability Age 65 to 74
Disability Age 65 to 74 Comparison
Crow
Immigrants from Dominican Republic
27.9%
DISABILITY AGE 65 TO 74
0.0/ 100
METRIC RATING
316th/ 347
METRIC RANK
27.0%
DISABILITY AGE 65 TO 74
0.0/ 100
METRIC RATING
300th/ 347
METRIC RANK
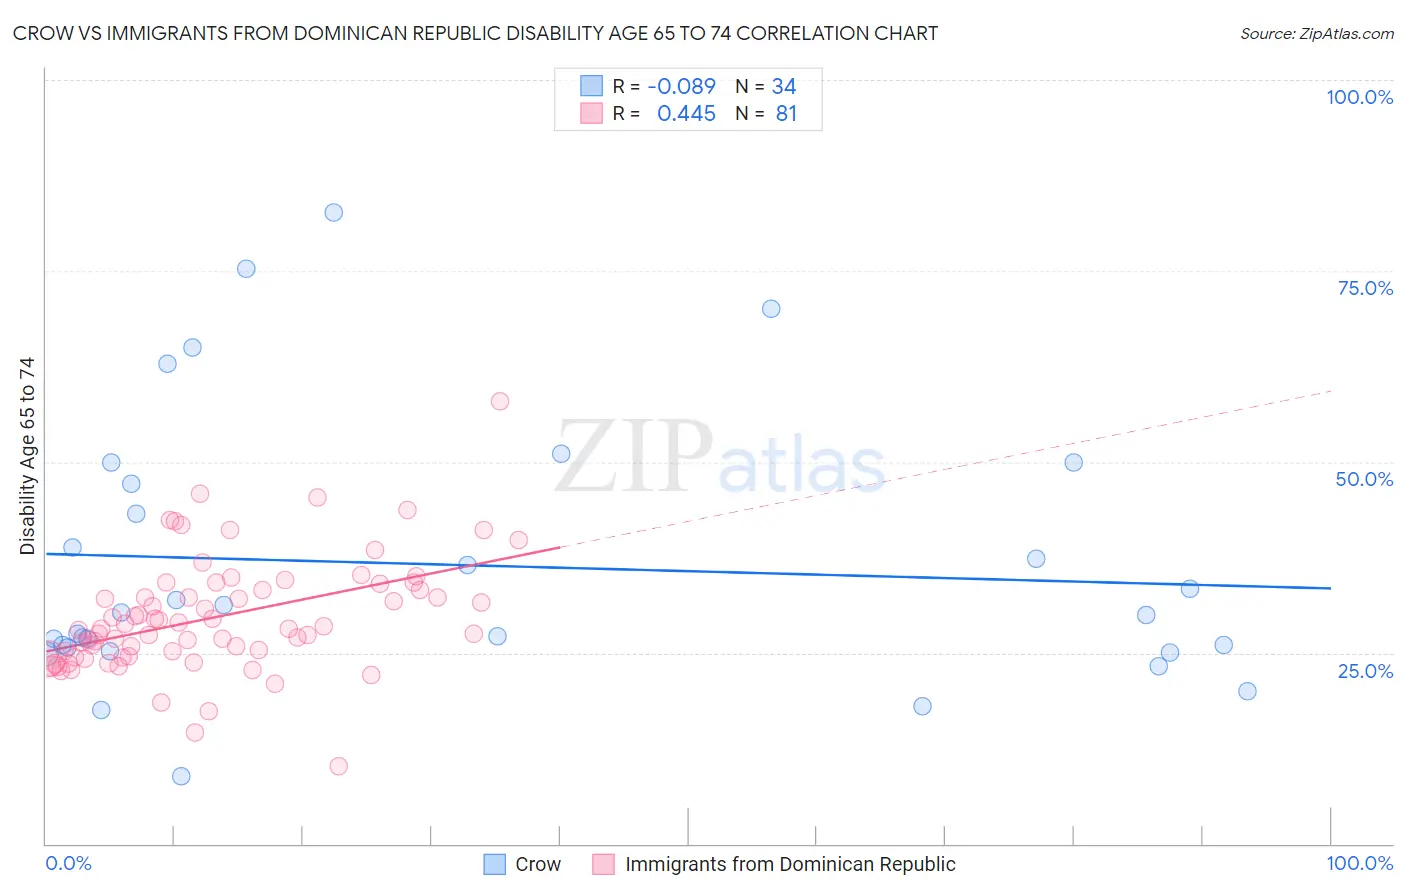
Crow vs Immigrants from Dominican Republic Disability Age 65 to 74 Correlation Chart
The statistical analysis conducted on geographies consisting of 59,176,380 people shows a slight negative correlation between the proportion of Crow and percentage of population with a disability between the ages 65 and 75 in the United States with a correlation coefficient (R) of -0.089 and weighted average of 27.9%. Similarly, the statistical analysis conducted on geographies consisting of 274,603,138 people shows a moderate positive correlation between the proportion of Immigrants from Dominican Republic and percentage of population with a disability between the ages 65 and 75 in the United States with a correlation coefficient (R) of 0.445 and weighted average of 27.0%, a difference of 3.4%.
Disability Age 65 to 74 Correlation Summary
| Measurement | Crow | Immigrants from Dominican Republic |
| Minimum | 8.8% | 10.1% |
| Maximum | 82.6% | 57.9% |
| Range | 73.8% | 47.8% |
| Mean | 36.5% | 29.7% |
| Median | 30.2% | 28.2% |
| Interquartile 25% (IQ1) | 25.8% | 24.5% |
| Interquartile 75% (IQ3) | 47.2% | 33.7% |
| Interquartile Range (IQR) | 21.4% | 9.2% |
| Standard Deviation (Sample) | 17.6% | 7.5% |
| Standard Deviation (Population) | 17.4% | 7.5% |
Demographics Similar to Crow and Immigrants from Dominican Republic by Disability Age 65 to 74
In terms of disability age 65 to 74, the demographic groups most similar to Crow are Cajun (27.9%, a difference of 0.040%), Immigrants from Armenia (28.0%, a difference of 0.090%), Nepalese (28.0%, a difference of 0.31%), Chippewa (27.8%, a difference of 0.52%), and Paiute (27.8%, a difference of 0.53%). Similarly, the demographic groups most similar to Immigrants from Dominican Republic are Potawatomi (27.0%, a difference of 0.030%), Immigrants from Yemen (27.0%, a difference of 0.060%), Immigrants from Mexico (27.1%, a difference of 0.32%), Central American Indian (27.1%, a difference of 0.33%), and Tlingit-Haida (27.1%, a difference of 0.39%).
| Demographics | Rating | Rank | Disability Age 65 to 74 |
| Immigrants | Yemen | 0.0 /100 | #298 | Tragic 27.0% |
| Potawatomi | 0.0 /100 | #299 | Tragic 27.0% |
| Immigrants | Dominican Republic | 0.0 /100 | #300 | Tragic 27.0% |
| Immigrants | Mexico | 0.0 /100 | #301 | Tragic 27.1% |
| Central American Indians | 0.0 /100 | #302 | Tragic 27.1% |
| Tlingit-Haida | 0.0 /100 | #303 | Tragic 27.1% |
| Puget Sound Salish | 0.0 /100 | #304 | Tragic 27.2% |
| Mexicans | 0.0 /100 | #305 | Tragic 27.2% |
| Blacks/African Americans | 0.0 /100 | #306 | Tragic 27.3% |
| Ute | 0.0 /100 | #307 | Tragic 27.3% |
| Sioux | 0.0 /100 | #308 | Tragic 27.3% |
| Yaqui | 0.0 /100 | #309 | Tragic 27.4% |
| Shoshone | 0.0 /100 | #310 | Tragic 27.4% |
| Menominee | 0.0 /100 | #311 | Tragic 27.4% |
| Osage | 0.0 /100 | #312 | Tragic 27.5% |
| Paiute | 0.0 /100 | #313 | Tragic 27.8% |
| Chippewa | 0.0 /100 | #314 | Tragic 27.8% |
| Cajuns | 0.0 /100 | #315 | Tragic 27.9% |
| Crow | 0.0 /100 | #316 | Tragic 27.9% |
| Immigrants | Armenia | 0.0 /100 | #317 | Tragic 28.0% |
| Nepalese | 0.0 /100 | #318 | Tragic 28.0% |