Immigrants from Hong Kong vs Immigrants from Dominican Republic Disability Age 65 to 74
COMPARE
Immigrants from Hong Kong
Immigrants from Dominican Republic
Disability Age 65 to 74
Disability Age 65 to 74 Comparison
Immigrants from Hong Kong
Immigrants from Dominican Republic
19.9%
DISABILITY AGE 65 TO 74
100.0/ 100
METRIC RATING
4th/ 347
METRIC RANK
27.0%
DISABILITY AGE 65 TO 74
0.0/ 100
METRIC RATING
300th/ 347
METRIC RANK
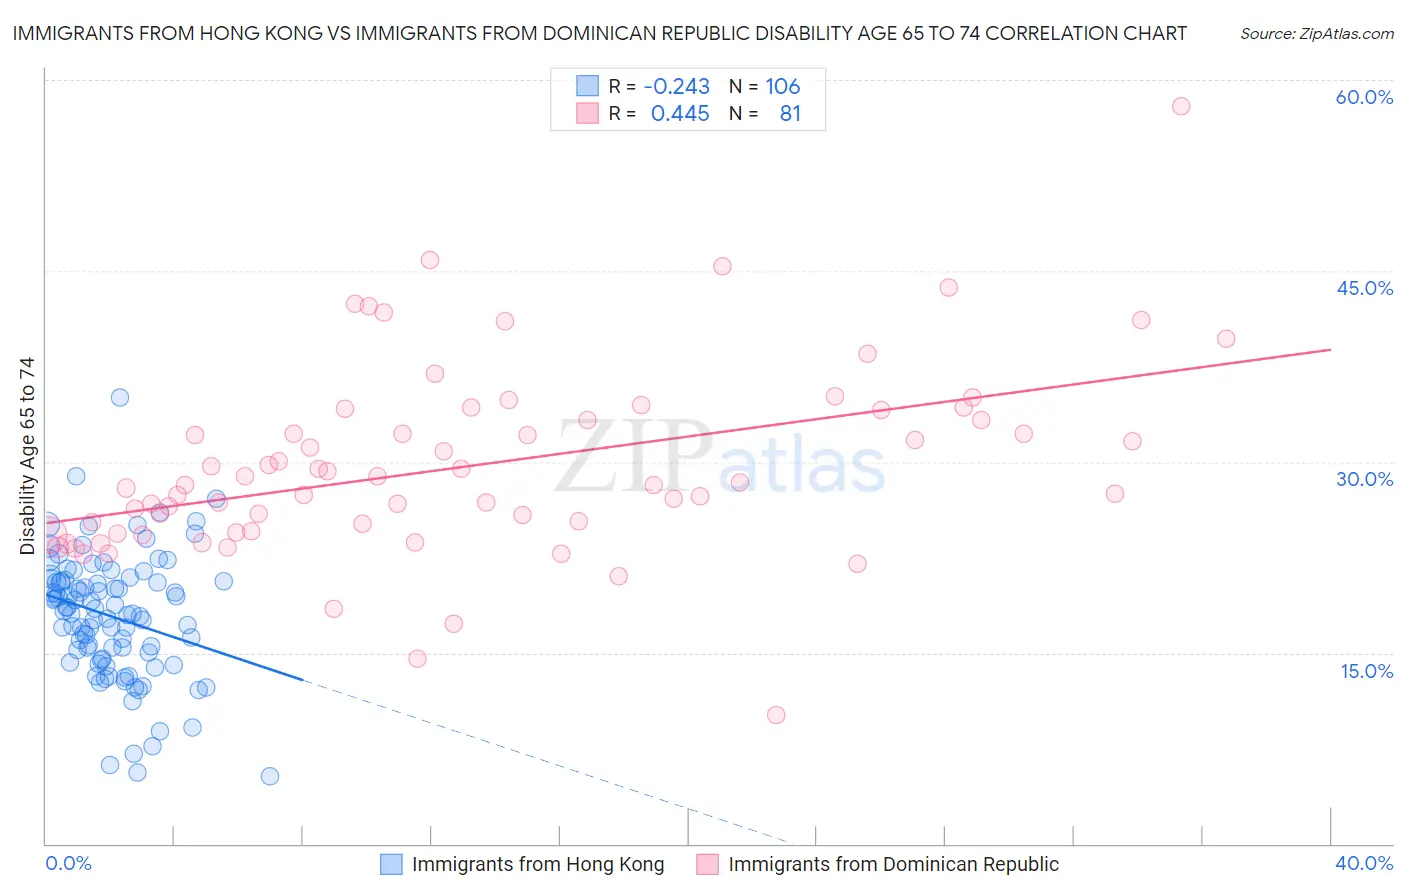
Immigrants from Hong Kong vs Immigrants from Dominican Republic Disability Age 65 to 74 Correlation Chart
The statistical analysis conducted on geographies consisting of 253,698,162 people shows a weak negative correlation between the proportion of Immigrants from Hong Kong and percentage of population with a disability between the ages 65 and 75 in the United States with a correlation coefficient (R) of -0.243 and weighted average of 19.9%. Similarly, the statistical analysis conducted on geographies consisting of 274,603,138 people shows a moderate positive correlation between the proportion of Immigrants from Dominican Republic and percentage of population with a disability between the ages 65 and 75 in the United States with a correlation coefficient (R) of 0.445 and weighted average of 27.0%, a difference of 36.1%.
Disability Age 65 to 74 Correlation Summary
| Measurement | Immigrants from Hong Kong | Immigrants from Dominican Republic |
| Minimum | 5.3% | 10.1% |
| Maximum | 35.1% | 57.9% |
| Range | 29.8% | 47.8% |
| Mean | 17.8% | 29.7% |
| Median | 18.2% | 28.2% |
| Interquartile 25% (IQ1) | 14.6% | 24.5% |
| Interquartile 75% (IQ3) | 20.6% | 33.7% |
| Interquartile Range (IQR) | 6.0% | 9.2% |
| Standard Deviation (Sample) | 5.0% | 7.5% |
| Standard Deviation (Population) | 4.9% | 7.5% |
Similar Demographics by Disability Age 65 to 74
Demographics Similar to Immigrants from Hong Kong by Disability Age 65 to 74
In terms of disability age 65 to 74, the demographic groups most similar to Immigrants from Hong Kong are Immigrants from Israel (19.9%, a difference of 0.30%), Iranian (19.9%, a difference of 0.41%), Immigrants from India (19.7%, a difference of 0.84%), Cypriot (20.1%, a difference of 1.1%), and Thai (20.1%, a difference of 1.1%).
| Demographics | Rating | Rank | Disability Age 65 to 74 |
| Immigrants | Taiwan | 100.0 /100 | #1 | Exceptional 18.8% |
| Filipinos | 100.0 /100 | #2 | Exceptional 19.0% |
| Immigrants | India | 100.0 /100 | #3 | Exceptional 19.7% |
| Immigrants | Hong Kong | 100.0 /100 | #4 | Exceptional 19.9% |
| Immigrants | Israel | 100.0 /100 | #5 | Exceptional 19.9% |
| Iranians | 100.0 /100 | #6 | Exceptional 19.9% |
| Cypriots | 100.0 /100 | #7 | Exceptional 20.1% |
| Thais | 100.0 /100 | #8 | Exceptional 20.1% |
| Immigrants | China | 100.0 /100 | #9 | Exceptional 20.3% |
| Immigrants | Eastern Asia | 100.0 /100 | #10 | Exceptional 20.3% |
| Immigrants | Ireland | 100.0 /100 | #11 | Exceptional 20.3% |
| Immigrants | Korea | 100.0 /100 | #12 | Exceptional 20.4% |
| Immigrants | Singapore | 100.0 /100 | #13 | Exceptional 20.4% |
| Indians (Asian) | 100.0 /100 | #14 | Exceptional 20.5% |
| Paraguayans | 100.0 /100 | #15 | Exceptional 20.5% |
Demographics Similar to Immigrants from Dominican Republic by Disability Age 65 to 74
In terms of disability age 65 to 74, the demographic groups most similar to Immigrants from Dominican Republic are Potawatomi (27.0%, a difference of 0.030%), Immigrants from Yemen (27.0%, a difference of 0.060%), Fijian (27.0%, a difference of 0.080%), Immigrants from Mexico (27.1%, a difference of 0.32%), and Central American Indian (27.1%, a difference of 0.33%).
| Demographics | Rating | Rank | Disability Age 65 to 74 |
| Immigrants | Central America | 0.0 /100 | #293 | Tragic 26.6% |
| Dominicans | 0.0 /100 | #294 | Tragic 26.7% |
| Hispanics or Latinos | 0.0 /100 | #295 | Tragic 26.7% |
| Bangladeshis | 0.0 /100 | #296 | Tragic 26.8% |
| Fijians | 0.0 /100 | #297 | Tragic 27.0% |
| Immigrants | Yemen | 0.0 /100 | #298 | Tragic 27.0% |
| Potawatomi | 0.0 /100 | #299 | Tragic 27.0% |
| Immigrants | Dominican Republic | 0.0 /100 | #300 | Tragic 27.0% |
| Immigrants | Mexico | 0.0 /100 | #301 | Tragic 27.1% |
| Central American Indians | 0.0 /100 | #302 | Tragic 27.1% |
| Tlingit-Haida | 0.0 /100 | #303 | Tragic 27.1% |
| Puget Sound Salish | 0.0 /100 | #304 | Tragic 27.2% |
| Mexicans | 0.0 /100 | #305 | Tragic 27.2% |
| Blacks/African Americans | 0.0 /100 | #306 | Tragic 27.3% |
| Ute | 0.0 /100 | #307 | Tragic 27.3% |