Yuman vs Immigrants from Dominican Republic Unemployment Among Ages 60 to 64 years
COMPARE
Yuman
Immigrants from Dominican Republic
Unemployment Among Ages 60 to 64 years
Unemployment Among Ages 60 to 64 years Comparison
Yuman
Immigrants from Dominican Republic
6.8%
UNEMPLOYMENT AMONG AGES 60 TO 64 YEARS
0.0/ 100
METRIC RATING
341st/ 347
METRIC RANK
6.0%
UNEMPLOYMENT AMONG AGES 60 TO 64 YEARS
0.0/ 100
METRIC RATING
333rd/ 347
METRIC RANK
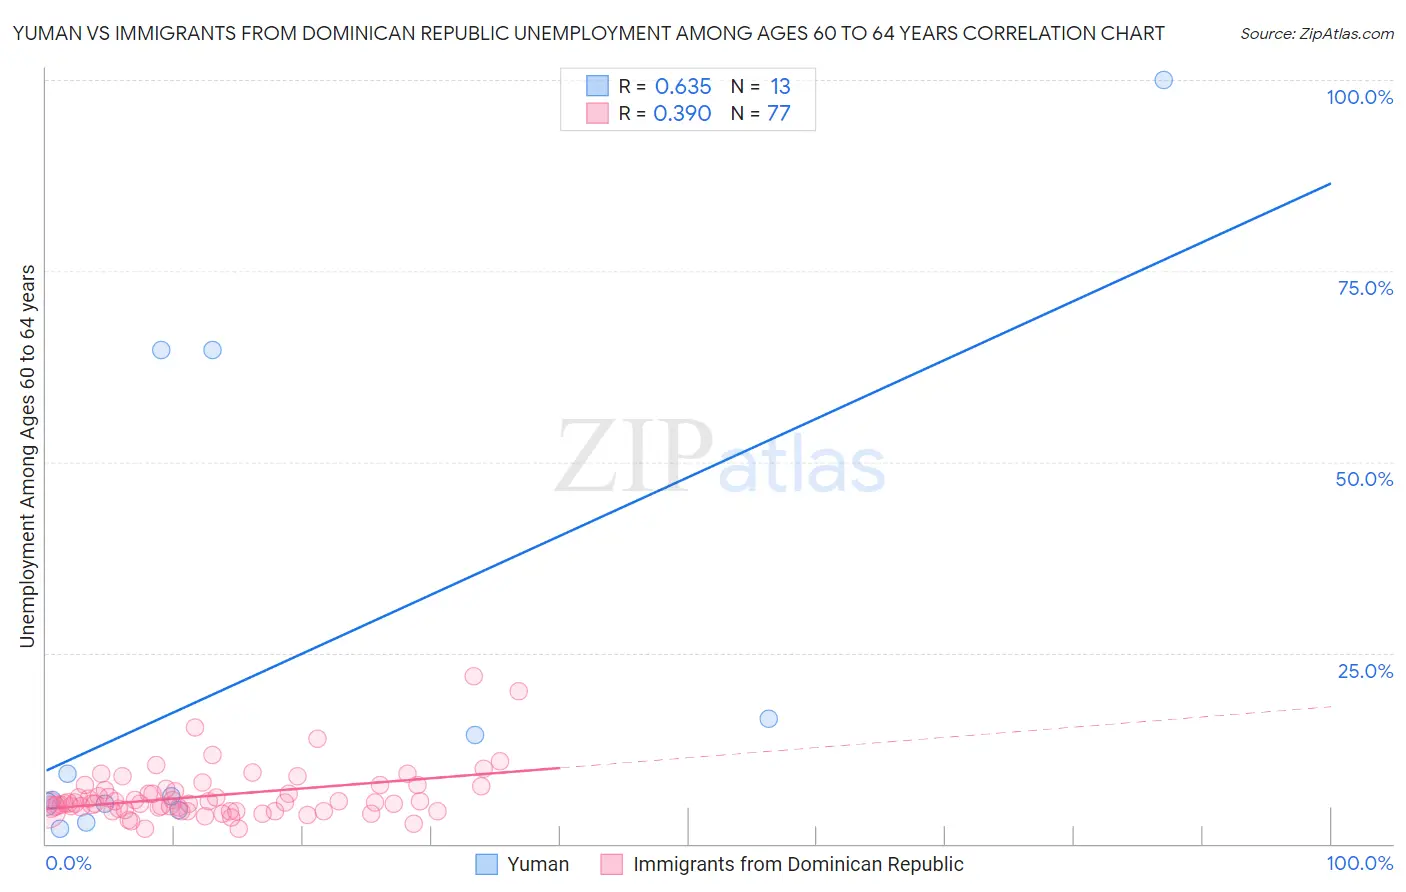
Yuman vs Immigrants from Dominican Republic Unemployment Among Ages 60 to 64 years Correlation Chart
The statistical analysis conducted on geographies consisting of 39,921,658 people shows a significant positive correlation between the proportion of Yuman and unemployment rate among population between the ages 60 and 64 in the United States with a correlation coefficient (R) of 0.635 and weighted average of 6.8%. Similarly, the statistical analysis conducted on geographies consisting of 256,183,735 people shows a mild positive correlation between the proportion of Immigrants from Dominican Republic and unemployment rate among population between the ages 60 and 64 in the United States with a correlation coefficient (R) of 0.390 and weighted average of 6.0%, a difference of 13.0%.
Unemployment Among Ages 60 to 64 years Correlation Summary
| Measurement | Yuman | Immigrants from Dominican Republic |
| Minimum | 2.0% | 1.9% |
| Maximum | 100.0% | 22.0% |
| Range | 98.0% | 20.1% |
| Mean | 23.1% | 6.3% |
| Median | 6.2% | 5.3% |
| Interquartile 25% (IQ1) | 4.8% | 4.4% |
| Interquartile 75% (IQ3) | 40.5% | 7.1% |
| Interquartile Range (IQR) | 35.8% | 2.7% |
| Standard Deviation (Sample) | 31.8% | 3.4% |
| Standard Deviation (Population) | 30.5% | 3.4% |
Demographics Similar to Yuman and Immigrants from Dominican Republic by Unemployment Among Ages 60 to 64 years
In terms of unemployment among ages 60 to 64 years, the demographic groups most similar to Yuman are Aleut (6.8%, a difference of 0.010%), Pueblo (6.7%, a difference of 0.53%), Immigrants from Yemen (6.8%, a difference of 0.73%), Tlingit-Haida (6.4%, a difference of 6.1%), and Arapaho (6.3%, a difference of 7.6%). Similarly, the demographic groups most similar to Immigrants from Dominican Republic are Dominican (6.0%, a difference of 0.35%), Yakama (6.0%, a difference of 0.37%), Immigrants from Armenia (6.0%, a difference of 0.51%), Immigrants from Bangladesh (6.0%, a difference of 0.77%), and Apache (6.0%, a difference of 0.78%).
| Demographics | Rating | Rank | Unemployment Among Ages 60 to 64 years |
| Immigrants | Grenada | 0.0 /100 | #327 | Tragic 5.9% |
| Apache | 0.0 /100 | #328 | Tragic 6.0% |
| Immigrants | Bangladesh | 0.0 /100 | #329 | Tragic 6.0% |
| Immigrants | Armenia | 0.0 /100 | #330 | Tragic 6.0% |
| Yakama | 0.0 /100 | #331 | Tragic 6.0% |
| Dominicans | 0.0 /100 | #332 | Tragic 6.0% |
| Immigrants | Dominican Republic | 0.0 /100 | #333 | Tragic 6.0% |
| Puerto Ricans | 0.0 /100 | #334 | Tragic 6.1% |
| Vietnamese | 0.0 /100 | #335 | Tragic 6.1% |
| Kiowa | 0.0 /100 | #336 | Tragic 6.2% |
| Navajo | 0.0 /100 | #337 | Tragic 6.3% |
| Arapaho | 0.0 /100 | #338 | Tragic 6.3% |
| Tlingit-Haida | 0.0 /100 | #339 | Tragic 6.4% |
| Pueblo | 0.0 /100 | #340 | Tragic 6.7% |
| Yuman | 0.0 /100 | #341 | Tragic 6.8% |
| Aleuts | 0.0 /100 | #342 | Tragic 6.8% |
| Immigrants | Yemen | 0.0 /100 | #343 | Tragic 6.8% |
| Alaska Natives | 0.0 /100 | #344 | Tragic 7.6% |
| Alaskan Athabascans | 0.0 /100 | #345 | Tragic 8.4% |
| Inupiat | 0.0 /100 | #346 | Tragic 9.6% |
| Yup'ik | 0.0 /100 | #347 | Tragic 11.9% |