Yugoslavian vs Immigrants from Hungary Vision Disability
COMPARE
Yugoslavian
Immigrants from Hungary
Vision Disability
Vision Disability Comparison
Yugoslavians
Immigrants from Hungary
2.2%
VISION DISABILITY
46.5/ 100
METRIC RATING
176th/ 347
METRIC RANK
2.1%
VISION DISABILITY
88.7/ 100
METRIC RATING
131st/ 347
METRIC RANK
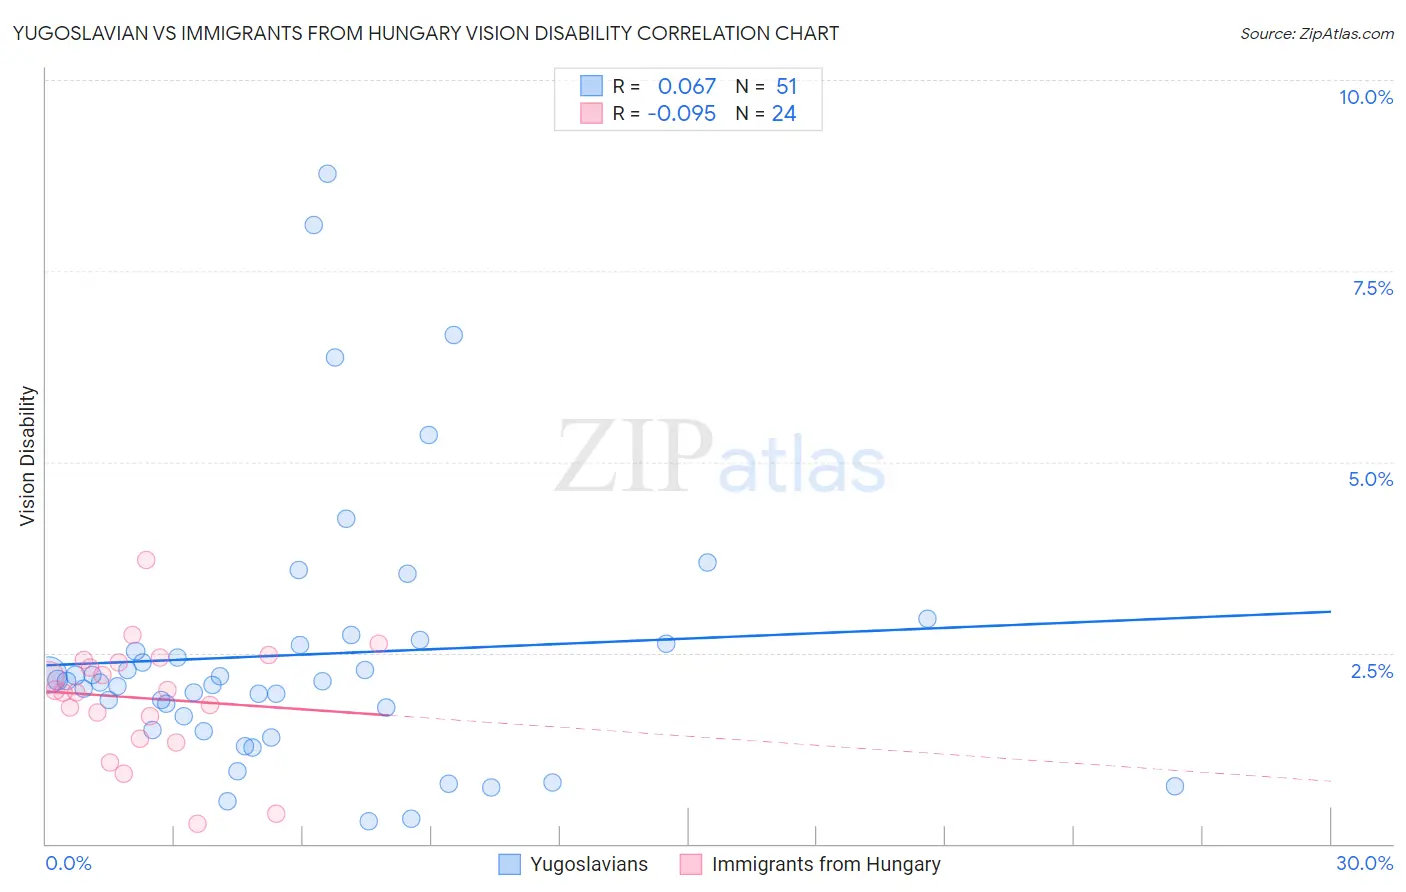
Yugoslavian vs Immigrants from Hungary Vision Disability Correlation Chart
The statistical analysis conducted on geographies consisting of 285,572,549 people shows a slight positive correlation between the proportion of Yugoslavians and percentage of population with vision disability in the United States with a correlation coefficient (R) of 0.067 and weighted average of 2.2%. Similarly, the statistical analysis conducted on geographies consisting of 195,649,550 people shows a slight negative correlation between the proportion of Immigrants from Hungary and percentage of population with vision disability in the United States with a correlation coefficient (R) of -0.095 and weighted average of 2.1%, a difference of 3.6%.
Vision Disability Correlation Summary
| Measurement | Yugoslavian | Immigrants from Hungary |
| Minimum | 0.30% | 0.26% |
| Maximum | 8.8% | 3.7% |
| Range | 8.5% | 3.5% |
| Mean | 2.5% | 1.9% |
| Median | 2.1% | 2.0% |
| Interquartile 25% (IQ1) | 1.5% | 1.5% |
| Interquartile 75% (IQ3) | 2.6% | 2.4% |
| Interquartile Range (IQR) | 1.1% | 0.87% |
| Standard Deviation (Sample) | 1.8% | 0.76% |
| Standard Deviation (Population) | 1.8% | 0.75% |
Similar Demographics by Vision Disability
Demographics Similar to Yugoslavians by Vision Disability
In terms of vision disability, the demographic groups most similar to Yugoslavians are Slavic (2.2%, a difference of 0.040%), Immigrants from Fiji (2.2%, a difference of 0.070%), Immigrants from Oceania (2.2%, a difference of 0.090%), Immigrants from North America (2.2%, a difference of 0.13%), and Northern European (2.2%, a difference of 0.22%).
| Demographics | Rating | Rank | Vision Disability |
| South American Indians | 57.4 /100 | #169 | Average 2.2% |
| Swiss | 55.7 /100 | #170 | Average 2.2% |
| Lebanese | 54.3 /100 | #171 | Average 2.2% |
| Northern Europeans | 50.1 /100 | #172 | Average 2.2% |
| Scandinavians | 50.0 /100 | #173 | Average 2.2% |
| Immigrants | Canada | 50.0 /100 | #174 | Average 2.2% |
| Immigrants | Fiji | 47.6 /100 | #175 | Average 2.2% |
| Yugoslavians | 46.5 /100 | #176 | Average 2.2% |
| Slavs | 46.0 /100 | #177 | Average 2.2% |
| Immigrants | Oceania | 45.1 /100 | #178 | Average 2.2% |
| Immigrants | North America | 44.5 /100 | #179 | Average 2.2% |
| Uruguayans | 42.7 /100 | #180 | Average 2.2% |
| Immigrants | Western Europe | 41.1 /100 | #181 | Average 2.2% |
| Costa Ricans | 40.7 /100 | #182 | Average 2.2% |
| Immigrants | Burma/Myanmar | 37.9 /100 | #183 | Fair 2.2% |
Demographics Similar to Immigrants from Hungary by Vision Disability
In terms of vision disability, the demographic groups most similar to Immigrants from Hungary are Immigrants from Kenya (2.1%, a difference of 0.010%), Immigrants from Cameroon (2.1%, a difference of 0.020%), Immigrants from Chile (2.1%, a difference of 0.050%), New Zealander (2.1%, a difference of 0.080%), and Sudanese (2.1%, a difference of 0.090%).
| Demographics | Rating | Rank | Vision Disability |
| Immigrants | Spain | 89.8 /100 | #124 | Excellent 2.1% |
| Immigrants | Venezuela | 89.8 /100 | #125 | Excellent 2.1% |
| Immigrants | Peru | 89.5 /100 | #126 | Excellent 2.1% |
| Sudanese | 89.2 /100 | #127 | Excellent 2.1% |
| Immigrants | Chile | 89.0 /100 | #128 | Excellent 2.1% |
| Immigrants | Cameroon | 88.8 /100 | #129 | Excellent 2.1% |
| Immigrants | Kenya | 88.7 /100 | #130 | Excellent 2.1% |
| Immigrants | Hungary | 88.7 /100 | #131 | Excellent 2.1% |
| New Zealanders | 88.2 /100 | #132 | Excellent 2.1% |
| Syrians | 87.5 /100 | #133 | Excellent 2.1% |
| Venezuelans | 87.2 /100 | #134 | Excellent 2.1% |
| Vietnamese | 86.7 /100 | #135 | Excellent 2.1% |
| Czechs | 86.3 /100 | #136 | Excellent 2.1% |
| Immigrants | South Eastern Asia | 86.3 /100 | #137 | Excellent 2.1% |
| Arabs | 86.3 /100 | #138 | Excellent 2.1% |