Latvian vs Immigrants from Hungary Vision Disability
COMPARE
Latvian
Immigrants from Hungary
Vision Disability
Vision Disability Comparison
Latvians
Immigrants from Hungary
2.0%
VISION DISABILITY
99.5/ 100
METRIC RATING
49th/ 347
METRIC RANK
2.1%
VISION DISABILITY
88.7/ 100
METRIC RATING
131st/ 347
METRIC RANK
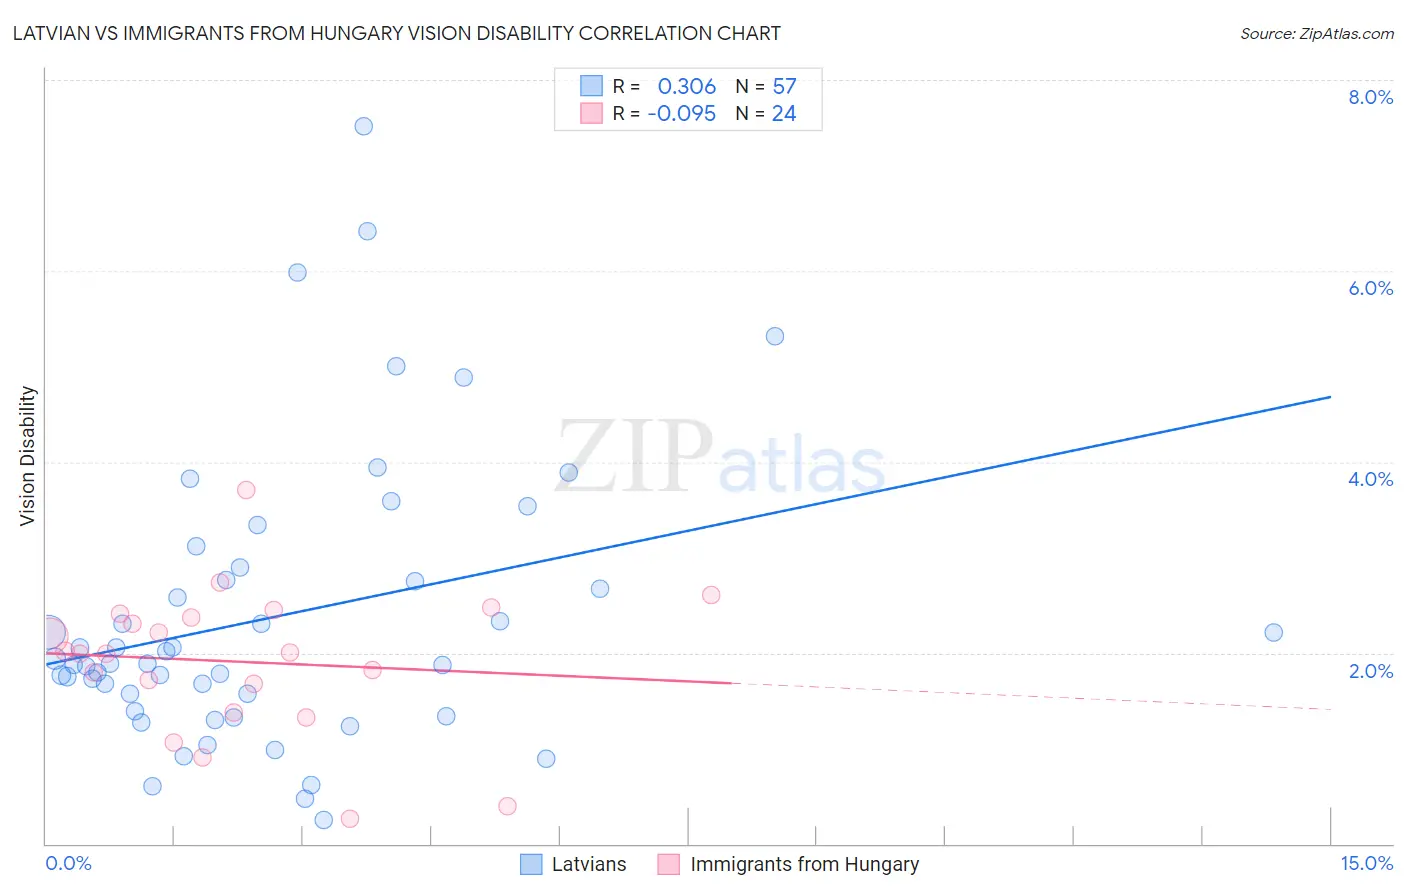
Latvian vs Immigrants from Hungary Vision Disability Correlation Chart
The statistical analysis conducted on geographies consisting of 220,626,631 people shows a mild positive correlation between the proportion of Latvians and percentage of population with vision disability in the United States with a correlation coefficient (R) of 0.306 and weighted average of 2.0%. Similarly, the statistical analysis conducted on geographies consisting of 195,649,550 people shows a slight negative correlation between the proportion of Immigrants from Hungary and percentage of population with vision disability in the United States with a correlation coefficient (R) of -0.095 and weighted average of 2.1%, a difference of 5.7%.
Vision Disability Correlation Summary
| Measurement | Latvian | Immigrants from Hungary |
| Minimum | 0.25% | 0.26% |
| Maximum | 7.5% | 3.7% |
| Range | 7.3% | 3.5% |
| Mean | 2.4% | 1.9% |
| Median | 1.9% | 2.0% |
| Interquartile 25% (IQ1) | 1.5% | 1.5% |
| Interquartile 75% (IQ3) | 2.8% | 2.4% |
| Interquartile Range (IQR) | 1.3% | 0.87% |
| Standard Deviation (Sample) | 1.5% | 0.76% |
| Standard Deviation (Population) | 1.5% | 0.75% |
Similar Demographics by Vision Disability
Demographics Similar to Latvians by Vision Disability
In terms of vision disability, the demographic groups most similar to Latvians are Afghan (2.0%, a difference of 0.060%), Israeli (2.0%, a difference of 0.070%), Tongan (2.0%, a difference of 0.15%), Immigrants from Serbia (2.0%, a difference of 0.46%), and Immigrants from Bulgaria (2.0%, a difference of 0.52%).
| Demographics | Rating | Rank | Vision Disability |
| Immigrants | Ethiopia | 99.7 /100 | #42 | Exceptional 2.0% |
| Eastern Europeans | 99.7 /100 | #43 | Exceptional 2.0% |
| Immigrants | Indonesia | 99.7 /100 | #44 | Exceptional 2.0% |
| Ethiopians | 99.7 /100 | #45 | Exceptional 2.0% |
| Immigrants | Sweden | 99.7 /100 | #46 | Exceptional 2.0% |
| Immigrants | Bulgaria | 99.7 /100 | #47 | Exceptional 2.0% |
| Israelis | 99.6 /100 | #48 | Exceptional 2.0% |
| Latvians | 99.5 /100 | #49 | Exceptional 2.0% |
| Afghans | 99.5 /100 | #50 | Exceptional 2.0% |
| Tongans | 99.5 /100 | #51 | Exceptional 2.0% |
| Immigrants | Serbia | 99.4 /100 | #52 | Exceptional 2.0% |
| Immigrants | Belarus | 99.3 /100 | #53 | Exceptional 2.0% |
| Macedonians | 99.3 /100 | #54 | Exceptional 2.0% |
| Laotians | 99.3 /100 | #55 | Exceptional 2.0% |
| Jordanians | 99.2 /100 | #56 | Exceptional 2.0% |
Demographics Similar to Immigrants from Hungary by Vision Disability
In terms of vision disability, the demographic groups most similar to Immigrants from Hungary are Immigrants from Kenya (2.1%, a difference of 0.010%), Immigrants from Cameroon (2.1%, a difference of 0.020%), Immigrants from Chile (2.1%, a difference of 0.050%), New Zealander (2.1%, a difference of 0.080%), and Sudanese (2.1%, a difference of 0.090%).
| Demographics | Rating | Rank | Vision Disability |
| Immigrants | Spain | 89.8 /100 | #124 | Excellent 2.1% |
| Immigrants | Venezuela | 89.8 /100 | #125 | Excellent 2.1% |
| Immigrants | Peru | 89.5 /100 | #126 | Excellent 2.1% |
| Sudanese | 89.2 /100 | #127 | Excellent 2.1% |
| Immigrants | Chile | 89.0 /100 | #128 | Excellent 2.1% |
| Immigrants | Cameroon | 88.8 /100 | #129 | Excellent 2.1% |
| Immigrants | Kenya | 88.7 /100 | #130 | Excellent 2.1% |
| Immigrants | Hungary | 88.7 /100 | #131 | Excellent 2.1% |
| New Zealanders | 88.2 /100 | #132 | Excellent 2.1% |
| Syrians | 87.5 /100 | #133 | Excellent 2.1% |
| Venezuelans | 87.2 /100 | #134 | Excellent 2.1% |
| Vietnamese | 86.7 /100 | #135 | Excellent 2.1% |
| Czechs | 86.3 /100 | #136 | Excellent 2.1% |
| Immigrants | South Eastern Asia | 86.3 /100 | #137 | Excellent 2.1% |
| Arabs | 86.3 /100 | #138 | Excellent 2.1% |