Yugoslavian vs Immigrants from Hungary Divorced or Separated
COMPARE
Yugoslavian
Immigrants from Hungary
Divorced or Separated
Divorced or Separated Comparison
Yugoslavians
Immigrants from Hungary
12.3%
DIVORCED OR SEPARATED
6.6/ 100
METRIC RATING
231st/ 347
METRIC RANK
11.9%
DIVORCED OR SEPARATED
73.7/ 100
METRIC RATING
152nd/ 347
METRIC RANK
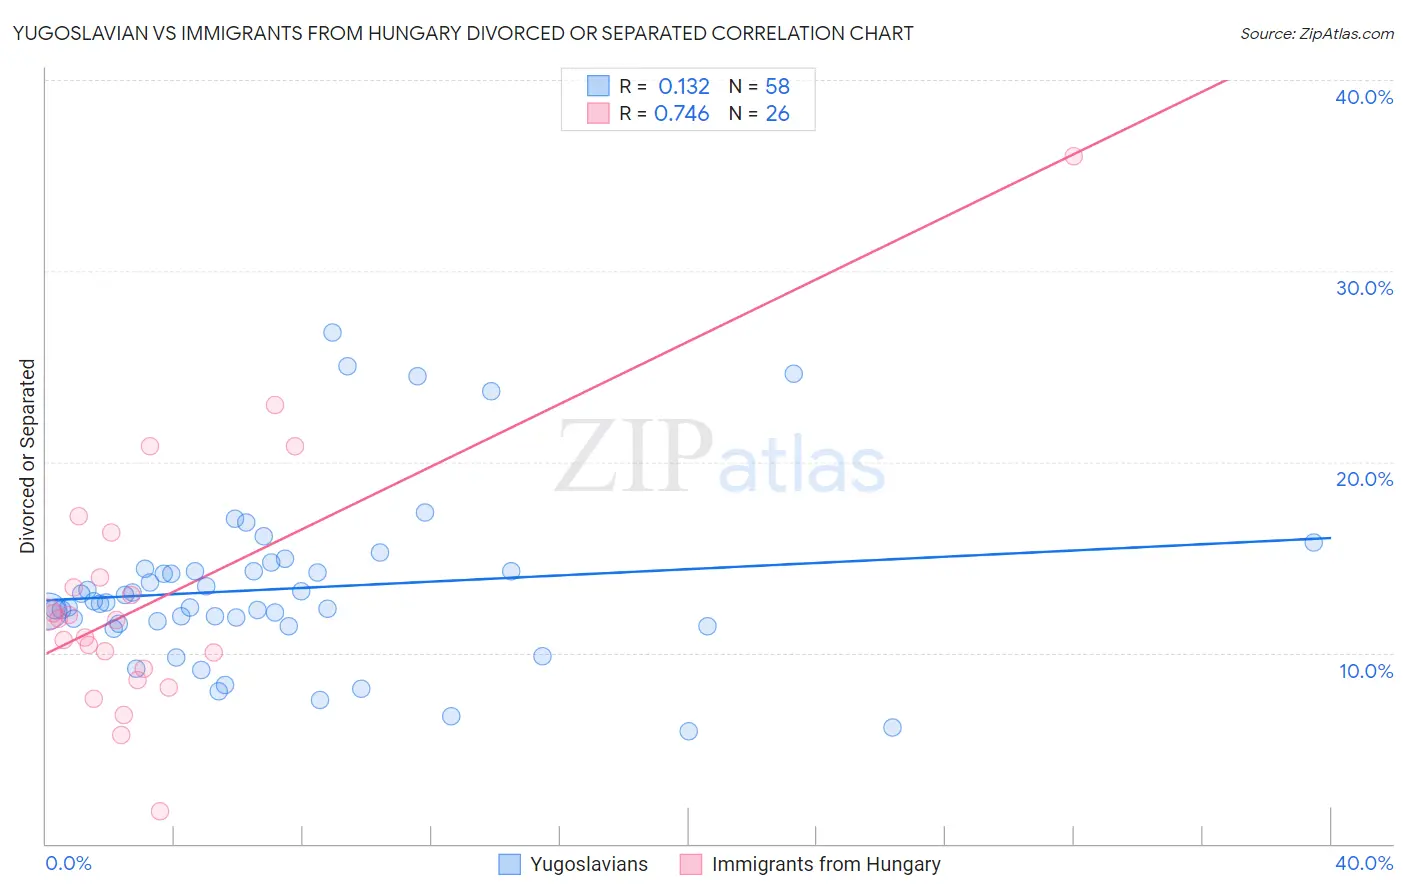
Yugoslavian vs Immigrants from Hungary Divorced or Separated Correlation Chart
The statistical analysis conducted on geographies consisting of 285,666,571 people shows a poor positive correlation between the proportion of Yugoslavians and percentage of population currently divorced or separated in the United States with a correlation coefficient (R) of 0.132 and weighted average of 12.3%. Similarly, the statistical analysis conducted on geographies consisting of 195,671,532 people shows a strong positive correlation between the proportion of Immigrants from Hungary and percentage of population currently divorced or separated in the United States with a correlation coefficient (R) of 0.746 and weighted average of 11.9%, a difference of 3.2%.
Divorced or Separated Correlation Summary
| Measurement | Yugoslavian | Immigrants from Hungary |
| Minimum | 5.9% | 1.7% |
| Maximum | 26.8% | 36.0% |
| Range | 20.9% | 34.3% |
| Mean | 13.4% | 12.8% |
| Median | 12.6% | 11.8% |
| Interquartile 25% (IQ1) | 11.5% | 9.2% |
| Interquartile 75% (IQ3) | 14.3% | 13.9% |
| Interquartile Range (IQR) | 2.8% | 4.7% |
| Standard Deviation (Sample) | 4.4% | 6.7% |
| Standard Deviation (Population) | 4.4% | 6.6% |
Similar Demographics by Divorced or Separated
Demographics Similar to Yugoslavians by Divorced or Separated
In terms of divorced or separated, the demographic groups most similar to Yugoslavians are Yakama (12.3%, a difference of 0.15%), Canadian (12.4%, a difference of 0.19%), Immigrants from Sudan (12.3%, a difference of 0.20%), Immigrants from Cameroon (12.3%, a difference of 0.22%), and Hmong (12.3%, a difference of 0.27%).
| Demographics | Rating | Rank | Divorced or Separated |
| Immigrants | Azores | 9.7 /100 | #224 | Tragic 12.3% |
| Belgians | 9.7 /100 | #225 | Tragic 12.3% |
| Immigrants | Western Africa | 9.3 /100 | #226 | Tragic 12.3% |
| Hmong | 8.8 /100 | #227 | Tragic 12.3% |
| Immigrants | Cameroon | 8.3 /100 | #228 | Tragic 12.3% |
| Immigrants | Sudan | 8.2 /100 | #229 | Tragic 12.3% |
| Yakama | 7.8 /100 | #230 | Tragic 12.3% |
| Yugoslavians | 6.6 /100 | #231 | Tragic 12.3% |
| Canadians | 5.3 /100 | #232 | Tragic 12.4% |
| Malaysians | 4.8 /100 | #233 | Tragic 12.4% |
| West Indians | 4.4 /100 | #234 | Tragic 12.4% |
| Immigrants | Bosnia and Herzegovina | 4.3 /100 | #235 | Tragic 12.4% |
| Colombians | 4.2 /100 | #236 | Tragic 12.4% |
| Immigrants | Laos | 4.2 /100 | #237 | Tragic 12.4% |
| Sudanese | 4.0 /100 | #238 | Tragic 12.4% |
Demographics Similar to Immigrants from Hungary by Divorced or Separated
In terms of divorced or separated, the demographic groups most similar to Immigrants from Hungary are Austrian (12.0%, a difference of 0.070%), Chilean (12.0%, a difference of 0.10%), Japanese (12.0%, a difference of 0.12%), Czech (11.9%, a difference of 0.13%), and Hungarian (12.0%, a difference of 0.15%).
| Demographics | Rating | Rank | Divorced or Separated |
| Croatians | 80.6 /100 | #145 | Excellent 11.9% |
| Immigrants | Grenada | 79.1 /100 | #146 | Good 11.9% |
| Poles | 78.6 /100 | #147 | Good 11.9% |
| Italians | 77.8 /100 | #148 | Good 11.9% |
| Immigrants | Oceania | 77.7 /100 | #149 | Good 11.9% |
| Immigrants | Portugal | 77.3 /100 | #150 | Good 11.9% |
| Czechs | 76.4 /100 | #151 | Good 11.9% |
| Immigrants | Hungary | 73.7 /100 | #152 | Good 11.9% |
| Austrians | 72.2 /100 | #153 | Good 12.0% |
| Chileans | 71.3 /100 | #154 | Good 12.0% |
| Japanese | 70.9 /100 | #155 | Good 12.0% |
| Hungarians | 70.3 /100 | #156 | Good 12.0% |
| Immigrants | Brazil | 68.8 /100 | #157 | Good 12.0% |
| Icelanders | 66.0 /100 | #158 | Good 12.0% |
| Immigrants | Barbados | 66.0 /100 | #159 | Good 12.0% |