Ottawa vs Immigrants from Hungary Vision Disability
COMPARE
Ottawa
Immigrants from Hungary
Vision Disability
Vision Disability Comparison
Ottawa
Immigrants from Hungary
2.5%
VISION DISABILITY
0.0/ 100
METRIC RATING
294th/ 347
METRIC RANK
2.1%
VISION DISABILITY
88.7/ 100
METRIC RATING
131st/ 347
METRIC RANK
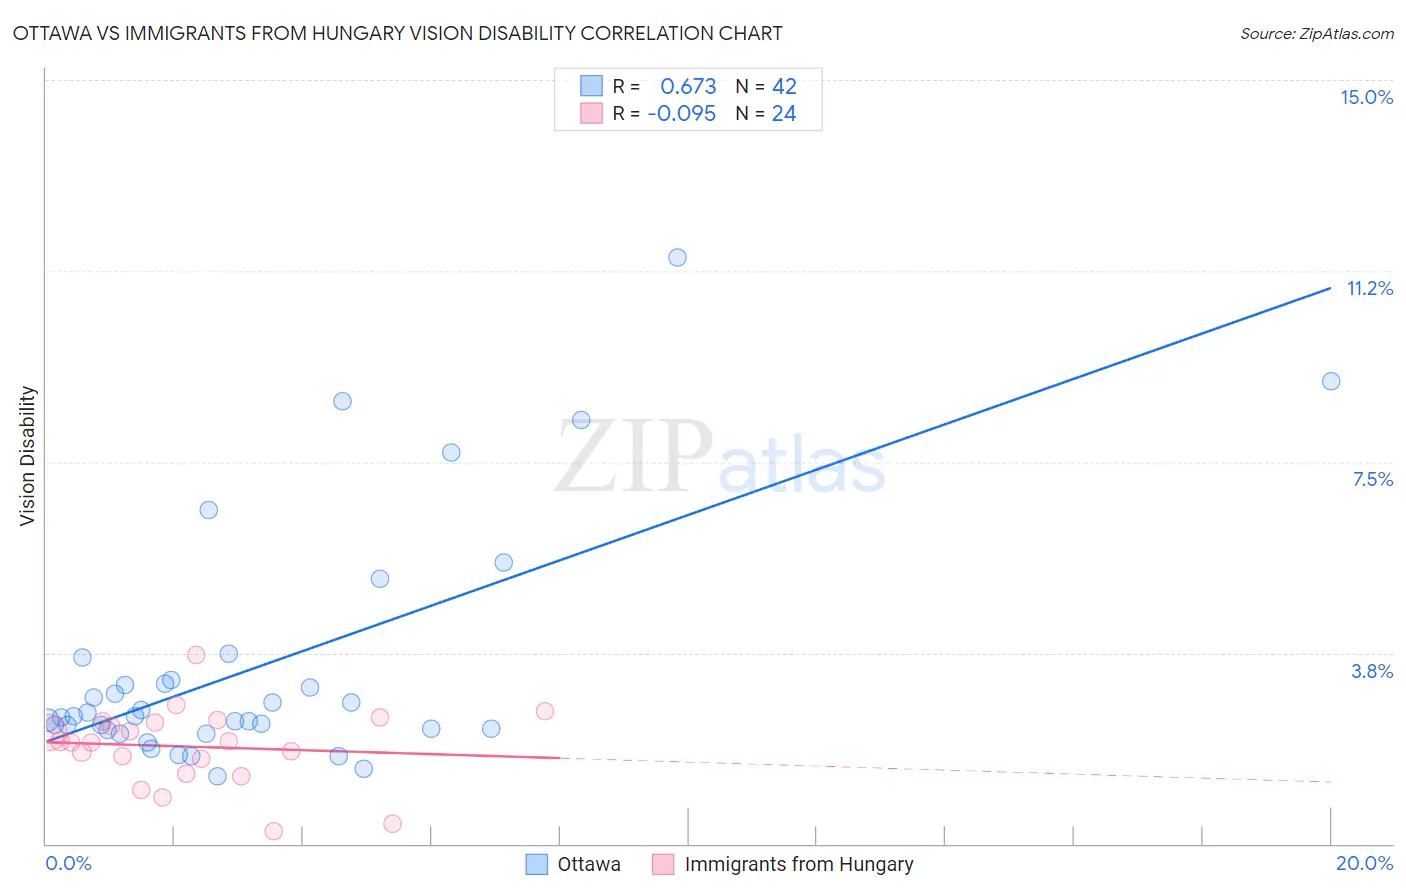
Ottawa vs Immigrants from Hungary Vision Disability Correlation Chart
The statistical analysis conducted on geographies consisting of 49,950,834 people shows a significant positive correlation between the proportion of Ottawa and percentage of population with vision disability in the United States with a correlation coefficient (R) of 0.673 and weighted average of 2.5%. Similarly, the statistical analysis conducted on geographies consisting of 195,649,550 people shows a slight negative correlation between the proportion of Immigrants from Hungary and percentage of population with vision disability in the United States with a correlation coefficient (R) of -0.095 and weighted average of 2.1%, a difference of 19.5%.
Vision Disability Correlation Summary
| Measurement | Ottawa | Immigrants from Hungary |
| Minimum | 1.3% | 0.26% |
| Maximum | 11.5% | 3.7% |
| Range | 10.2% | 3.5% |
| Mean | 3.5% | 1.9% |
| Median | 2.5% | 2.0% |
| Interquartile 25% (IQ1) | 2.2% | 1.5% |
| Interquartile 75% (IQ3) | 3.2% | 2.4% |
| Interquartile Range (IQR) | 0.96% | 0.87% |
| Standard Deviation (Sample) | 2.4% | 0.76% |
| Standard Deviation (Population) | 2.3% | 0.75% |
Similar Demographics by Vision Disability
Demographics Similar to Ottawa by Vision Disability
In terms of vision disability, the demographic groups most similar to Ottawa are Delaware (2.5%, a difference of 0.21%), Immigrants from Mexico (2.5%, a difference of 0.32%), Yaqui (2.5%, a difference of 0.34%), Crow (2.5%, a difference of 0.36%), and Immigrants from Honduras (2.5%, a difference of 0.46%).
| Demographics | Rating | Rank | Vision Disability |
| Hondurans | 0.0 /100 | #287 | Tragic 2.5% |
| French American Indians | 0.0 /100 | #288 | Tragic 2.5% |
| Immigrants | Nonimmigrants | 0.0 /100 | #289 | Tragic 2.5% |
| Immigrants | Cuba | 0.0 /100 | #290 | Tragic 2.5% |
| Immigrants | Honduras | 0.0 /100 | #291 | Tragic 2.5% |
| Crow | 0.0 /100 | #292 | Tragic 2.5% |
| Yaqui | 0.0 /100 | #293 | Tragic 2.5% |
| Ottawa | 0.0 /100 | #294 | Tragic 2.5% |
| Delaware | 0.0 /100 | #295 | Tragic 2.5% |
| Immigrants | Mexico | 0.0 /100 | #296 | Tragic 2.5% |
| Immigrants | Dominica | 0.0 /100 | #297 | Tragic 2.5% |
| Mexicans | 0.0 /100 | #298 | Tragic 2.5% |
| Cree | 0.0 /100 | #299 | Tragic 2.5% |
| Africans | 0.0 /100 | #300 | Tragic 2.5% |
| Menominee | 0.0 /100 | #301 | Tragic 2.5% |
Demographics Similar to Immigrants from Hungary by Vision Disability
In terms of vision disability, the demographic groups most similar to Immigrants from Hungary are Immigrants from Kenya (2.1%, a difference of 0.010%), Immigrants from Cameroon (2.1%, a difference of 0.020%), Immigrants from Chile (2.1%, a difference of 0.050%), New Zealander (2.1%, a difference of 0.080%), and Sudanese (2.1%, a difference of 0.090%).
| Demographics | Rating | Rank | Vision Disability |
| Immigrants | Spain | 89.8 /100 | #124 | Excellent 2.1% |
| Immigrants | Venezuela | 89.8 /100 | #125 | Excellent 2.1% |
| Immigrants | Peru | 89.5 /100 | #126 | Excellent 2.1% |
| Sudanese | 89.2 /100 | #127 | Excellent 2.1% |
| Immigrants | Chile | 89.0 /100 | #128 | Excellent 2.1% |
| Immigrants | Cameroon | 88.8 /100 | #129 | Excellent 2.1% |
| Immigrants | Kenya | 88.7 /100 | #130 | Excellent 2.1% |
| Immigrants | Hungary | 88.7 /100 | #131 | Excellent 2.1% |
| New Zealanders | 88.2 /100 | #132 | Excellent 2.1% |
| Syrians | 87.5 /100 | #133 | Excellent 2.1% |
| Venezuelans | 87.2 /100 | #134 | Excellent 2.1% |
| Vietnamese | 86.7 /100 | #135 | Excellent 2.1% |
| Czechs | 86.3 /100 | #136 | Excellent 2.1% |
| Immigrants | South Eastern Asia | 86.3 /100 | #137 | Excellent 2.1% |
| Arabs | 86.3 /100 | #138 | Excellent 2.1% |