Yugoslavian vs South American Indian Vision Disability
COMPARE
Yugoslavian
South American Indian
Vision Disability
Vision Disability Comparison
Yugoslavians
South American Indians
2.2%
VISION DISABILITY
46.5/ 100
METRIC RATING
176th/ 347
METRIC RANK
2.2%
VISION DISABILITY
57.4/ 100
METRIC RATING
169th/ 347
METRIC RANK
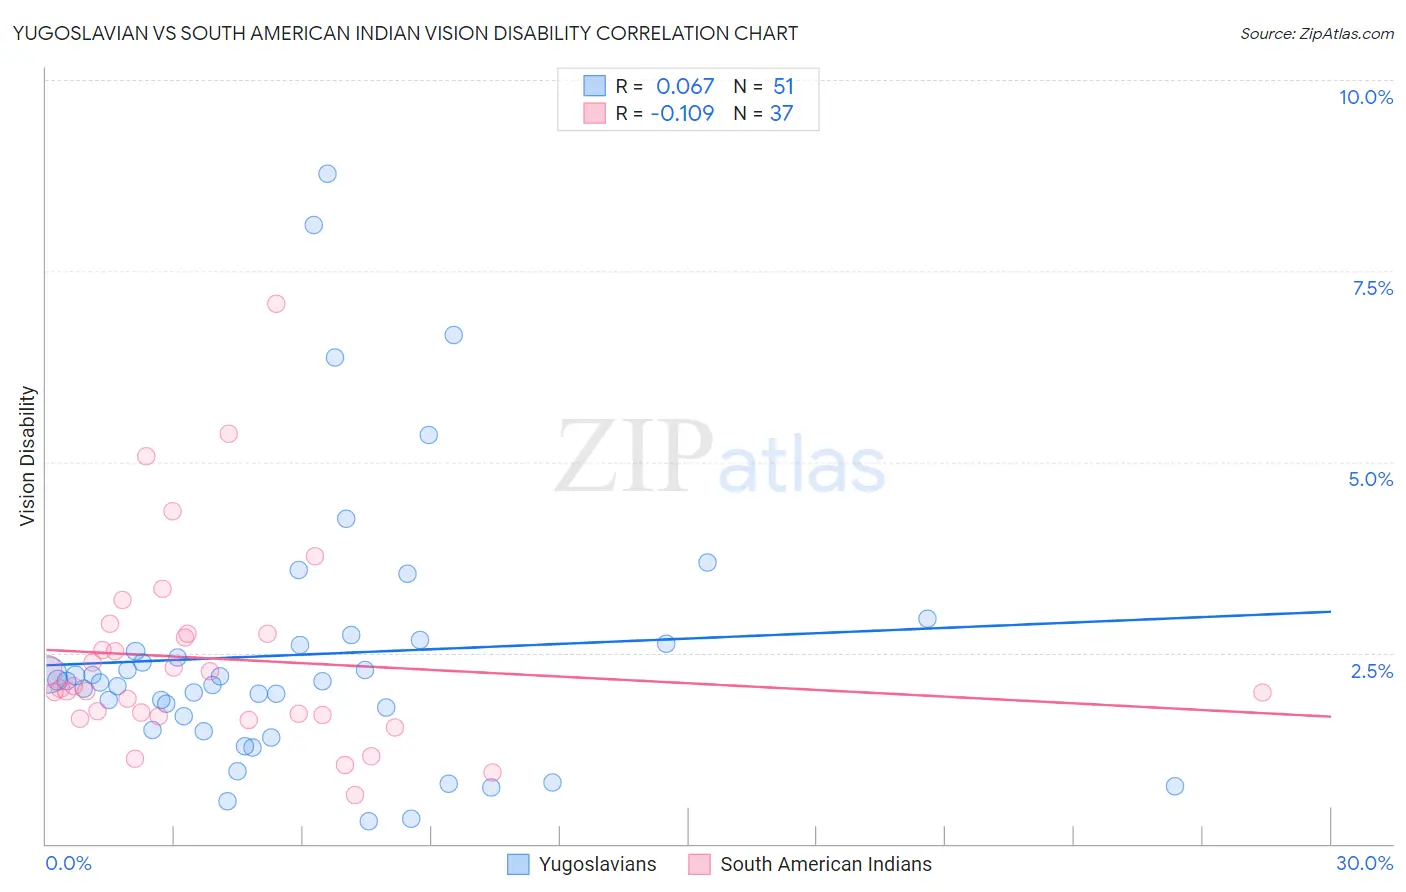
Yugoslavian vs South American Indian Vision Disability Correlation Chart
The statistical analysis conducted on geographies consisting of 285,572,549 people shows a slight positive correlation between the proportion of Yugoslavians and percentage of population with vision disability in the United States with a correlation coefficient (R) of 0.067 and weighted average of 2.2%. Similarly, the statistical analysis conducted on geographies consisting of 164,540,973 people shows a poor negative correlation between the proportion of South American Indians and percentage of population with vision disability in the United States with a correlation coefficient (R) of -0.109 and weighted average of 2.2%, a difference of 0.69%.
Vision Disability Correlation Summary
| Measurement | Yugoslavian | South American Indian |
| Minimum | 0.30% | 0.64% |
| Maximum | 8.8% | 7.1% |
| Range | 8.5% | 6.4% |
| Mean | 2.5% | 2.4% |
| Median | 2.1% | 2.0% |
| Interquartile 25% (IQ1) | 1.5% | 1.7% |
| Interquartile 75% (IQ3) | 2.6% | 2.8% |
| Interquartile Range (IQR) | 1.1% | 1.1% |
| Standard Deviation (Sample) | 1.8% | 1.3% |
| Standard Deviation (Population) | 1.8% | 1.3% |
Demographics Similar to Yugoslavians and South American Indians by Vision Disability
In terms of vision disability, the demographic groups most similar to Yugoslavians are Slavic (2.2%, a difference of 0.040%), Immigrants from Fiji (2.2%, a difference of 0.070%), Immigrants from Oceania (2.2%, a difference of 0.090%), Immigrants from North America (2.2%, a difference of 0.13%), and Northern European (2.2%, a difference of 0.22%). Similarly, the demographic groups most similar to South American Indians are Swiss (2.2%, a difference of 0.11%), Lebanese (2.2%, a difference of 0.20%), Brazilian (2.1%, a difference of 0.32%), Immigrants from Africa (2.1%, a difference of 0.34%), and Immigrants from England (2.1%, a difference of 0.36%).
| Demographics | Rating | Rank | Vision Disability |
| Hungarians | 67.4 /100 | #162 | Good 2.1% |
| Icelanders | 66.1 /100 | #163 | Good 2.1% |
| Immigrants | Bangladesh | 65.5 /100 | #164 | Good 2.1% |
| Immigrants | Iraq | 64.8 /100 | #165 | Good 2.1% |
| Immigrants | England | 62.8 /100 | #166 | Good 2.1% |
| Immigrants | Africa | 62.6 /100 | #167 | Good 2.1% |
| Brazilians | 62.2 /100 | #168 | Good 2.1% |
| South American Indians | 57.4 /100 | #169 | Average 2.2% |
| Swiss | 55.7 /100 | #170 | Average 2.2% |
| Lebanese | 54.3 /100 | #171 | Average 2.2% |
| Northern Europeans | 50.1 /100 | #172 | Average 2.2% |
| Scandinavians | 50.0 /100 | #173 | Average 2.2% |
| Immigrants | Canada | 50.0 /100 | #174 | Average 2.2% |
| Immigrants | Fiji | 47.6 /100 | #175 | Average 2.2% |
| Yugoslavians | 46.5 /100 | #176 | Average 2.2% |
| Slavs | 46.0 /100 | #177 | Average 2.2% |
| Immigrants | Oceania | 45.1 /100 | #178 | Average 2.2% |
| Immigrants | North America | 44.5 /100 | #179 | Average 2.2% |
| Uruguayans | 42.7 /100 | #180 | Average 2.2% |
| Immigrants | Western Europe | 41.1 /100 | #181 | Average 2.2% |
| Costa Ricans | 40.7 /100 | #182 | Average 2.2% |