Immigrants from Laos vs Immigrants from Hungary Vision Disability
COMPARE
Immigrants from Laos
Immigrants from Hungary
Vision Disability
Vision Disability Comparison
Immigrants from Laos
Immigrants from Hungary
2.4%
VISION DISABILITY
0.4/ 100
METRIC RATING
251st/ 347
METRIC RANK
2.1%
VISION DISABILITY
88.7/ 100
METRIC RATING
131st/ 347
METRIC RANK
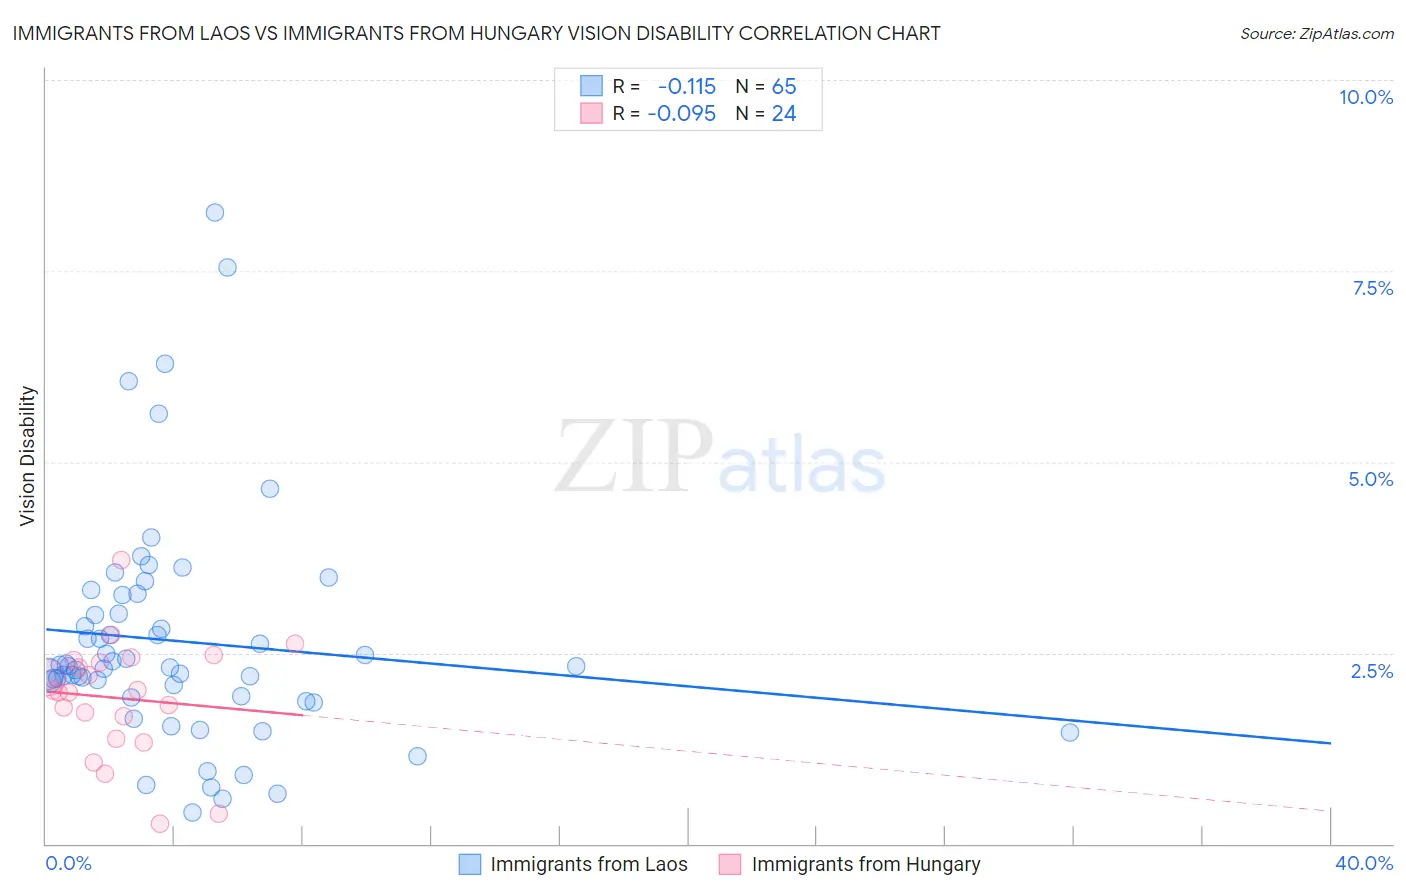
Immigrants from Laos vs Immigrants from Hungary Vision Disability Correlation Chart
The statistical analysis conducted on geographies consisting of 201,435,761 people shows a poor negative correlation between the proportion of Immigrants from Laos and percentage of population with vision disability in the United States with a correlation coefficient (R) of -0.115 and weighted average of 2.4%. Similarly, the statistical analysis conducted on geographies consisting of 195,649,550 people shows a slight negative correlation between the proportion of Immigrants from Hungary and percentage of population with vision disability in the United States with a correlation coefficient (R) of -0.095 and weighted average of 2.1%, a difference of 12.2%.
Vision Disability Correlation Summary
| Measurement | Immigrants from Laos | Immigrants from Hungary |
| Minimum | 0.41% | 0.26% |
| Maximum | 8.3% | 3.7% |
| Range | 7.8% | 3.5% |
| Mean | 2.7% | 1.9% |
| Median | 2.3% | 2.0% |
| Interquartile 25% (IQ1) | 1.9% | 1.5% |
| Interquartile 75% (IQ3) | 3.1% | 2.4% |
| Interquartile Range (IQR) | 1.2% | 0.87% |
| Standard Deviation (Sample) | 1.5% | 0.76% |
| Standard Deviation (Population) | 1.5% | 0.75% |
Similar Demographics by Vision Disability
Demographics Similar to Immigrants from Laos by Vision Disability
In terms of vision disability, the demographic groups most similar to Immigrants from Laos are Bangladeshi (2.3%, a difference of 0.11%), Liberian (2.3%, a difference of 0.19%), Subsaharan African (2.3%, a difference of 0.21%), Guatemalan (2.3%, a difference of 0.23%), and French (2.3%, a difference of 0.27%).
| Demographics | Rating | Rank | Vision Disability |
| Immigrants | West Indies | 0.6 /100 | #244 | Tragic 2.3% |
| Alsatians | 0.6 /100 | #245 | Tragic 2.3% |
| French | 0.5 /100 | #246 | Tragic 2.3% |
| Guatemalans | 0.5 /100 | #247 | Tragic 2.3% |
| Sub-Saharan Africans | 0.5 /100 | #248 | Tragic 2.3% |
| Liberians | 0.5 /100 | #249 | Tragic 2.3% |
| Bangladeshis | 0.5 /100 | #250 | Tragic 2.3% |
| Immigrants | Laos | 0.4 /100 | #251 | Tragic 2.4% |
| Immigrants | Micronesia | 0.3 /100 | #252 | Tragic 2.4% |
| Japanese | 0.3 /100 | #253 | Tragic 2.4% |
| Haitians | 0.3 /100 | #254 | Tragic 2.4% |
| Immigrants | Guatemala | 0.3 /100 | #255 | Tragic 2.4% |
| Immigrants | Haiti | 0.2 /100 | #256 | Tragic 2.4% |
| West Indians | 0.2 /100 | #257 | Tragic 2.4% |
| British West Indians | 0.2 /100 | #258 | Tragic 2.4% |
Demographics Similar to Immigrants from Hungary by Vision Disability
In terms of vision disability, the demographic groups most similar to Immigrants from Hungary are Immigrants from Kenya (2.1%, a difference of 0.010%), Immigrants from Cameroon (2.1%, a difference of 0.020%), Immigrants from Chile (2.1%, a difference of 0.050%), New Zealander (2.1%, a difference of 0.080%), and Sudanese (2.1%, a difference of 0.090%).
| Demographics | Rating | Rank | Vision Disability |
| Immigrants | Spain | 89.8 /100 | #124 | Excellent 2.1% |
| Immigrants | Venezuela | 89.8 /100 | #125 | Excellent 2.1% |
| Immigrants | Peru | 89.5 /100 | #126 | Excellent 2.1% |
| Sudanese | 89.2 /100 | #127 | Excellent 2.1% |
| Immigrants | Chile | 89.0 /100 | #128 | Excellent 2.1% |
| Immigrants | Cameroon | 88.8 /100 | #129 | Excellent 2.1% |
| Immigrants | Kenya | 88.7 /100 | #130 | Excellent 2.1% |
| Immigrants | Hungary | 88.7 /100 | #131 | Excellent 2.1% |
| New Zealanders | 88.2 /100 | #132 | Excellent 2.1% |
| Syrians | 87.5 /100 | #133 | Excellent 2.1% |
| Venezuelans | 87.2 /100 | #134 | Excellent 2.1% |
| Vietnamese | 86.7 /100 | #135 | Excellent 2.1% |
| Czechs | 86.3 /100 | #136 | Excellent 2.1% |
| Immigrants | South Eastern Asia | 86.3 /100 | #137 | Excellent 2.1% |
| Arabs | 86.3 /100 | #138 | Excellent 2.1% |