Yugoslavian vs Immigrants from China Vision Disability

COMPARE

Yugoslavian
Race
Ancestry
AfghanAfricanAlaska NativeAlaskan AthabascanAlbanianAleutAlsatianAmericanApacheArabArapahoArgentineanArmenianAssyrian/Chaldean/SyriacAustralianAustrianBahamianBangladeshiBarbadianBasqueBelgianBelizeanBermudanBhutaneseBlackfeetBolivianBrazilianBritishBritish West IndianBulgarianBurmeseCajunCambodianCanadianCape VerdeanCarpatho RusynCelticCentral AmericanCentral American IndianCherokeeCheyenneChickasawChileanChineseChippewaChoctawColombianColvilleComancheCosta RicanCreeCreekCroatianCrowCubanCypriotCzechCzechoslovakianDanishDelawareDominicanDutchDutch West IndianEastern EuropeanEcuadorianEgyptianEnglishEstonianEthiopianEuropeanFijianFilipinoFinnishFrenchFrench American IndianFrench CanadianGermanGerman RussianGhanaianGreekGuamanian/ChamorroGuatemalanGuyaneseHaitianHmongHonduranHopiHoumaHungarianIcelanderIndian (Asian)IndonesianInupiatIranianIraqiIrishIroquoisIsraeliItalianJamaicanJapaneseJordanianKenyanKiowaKoreanLaotianLatvianLebaneseLiberianLithuanianLumbeeLuxembourgerMacedonianMalaysianMalteseMarshalleseMenomineeMexicanMexican American IndianMongolianMoroccanNative HawaiianNavajoNepaleseNew ZealanderNicaraguanNigerianNorthern EuropeanNorwegianOkinawanOsageOttawaPaiutePakistaniPalestinianPanamanianParaguayanPennsylvania GermanPeruvianPimaPolishPortuguesePotawatomiPuebloPuerto RicanPuget Sound SalishRomanianRussianSalvadoranSamoanScandinavianScotch-IrishScottishSeminoleSenegaleseSerbianShoshoneSierra LeoneanSiouxSlavicSlovakSloveneSomaliSouth AfricanSouth AmericanSouth American IndianSoviet UnionSpaniardSpanishSpanish AmericanSpanish American IndianSri LankanSubsaharan AfricanSudaneseSwedishSwissSyrianTaiwaneseThaiTlingit-HaidaTohono O'OdhamTonganTrinidadian and TobagonianTsimshianTurkishU.S. Virgin IslanderUgandanUkrainianUruguayanUteVenezuelanVietnameseWelshWest IndianYakamaYaquiYugoslavianYumanYup'ikZimbabwean
Immigration
NonimmigrantsImmigrantsAfghanistanAfricaAlbaniaArgentinaArmeniaAsiaAustraliaAustriaBahamasBangladeshBarbadosBelarusBelgiumBelizeBoliviaBosnia and HerzegovinaBrazilBulgariaBurma/MyanmarCabo VerdeCambodiaCameroonCanadaCaribbeanCentral AmericaChileColombiaCongoCosta RicaCroatiaCubaCzechoslovakiaDenmarkDominicaDominican RepublicEastern AfricaEastern AsiaEastern EuropeEcuadorEgyptEl SalvadorEnglandEritreaEthiopiaEuropeFijiFranceGermanyGhanaGreeceGrenadaGuatemalaGuyanaHaitiHondurasHong KongHungaryIndiaIndonesiaIranIraqIrelandIsraelItalyJamaicaJapanJordanKazakhstanKenyaKoreaKuwaitLaosLatin AmericaLatviaLebanonLiberiaLithuaniaMalaysiaMexicoMicronesiaMiddle AfricaMoldovaMoroccoNepalNetherlandsNicaraguaNigeriaNorth AmericaNorth MacedoniaNorthern AfricaNorthern EuropeNorwayOceaniaPakistanPanamaPeruPhilippinesPolandPortugalRomaniaRussiaSaudi ArabiaScotlandSenegalSerbiaSierra LeoneSingaporeSomaliaSouth AfricaSouth AmericaSouth Central AsiaSouth Eastern AsiaSouthern EuropeSpainSri LankaSt. Vincent and the GrenadinesSudanSwedenSwitzerlandSyriaTaiwanThailandTrinidad and TobagoTurkeyUgandaUkraineUruguayUzbekistanVenezuelaVietnamWest IndiesWestern AfricaWestern AsiaWestern EuropeYemenZaireZimbabweAzores
Immigrants from China
Race
Ancestry
AfghanAfricanAlaska NativeAlaskan AthabascanAlbanianAleutAlsatianAmericanApacheArabArapahoArgentineanArmenianAssyrian/Chaldean/SyriacAustralianAustrianBahamianBangladeshiBarbadianBasqueBelgianBelizeanBermudanBhutaneseBlackfeetBolivianBrazilianBritishBritish West IndianBulgarianBurmeseCajunCambodianCanadianCape VerdeanCarpatho RusynCelticCentral AmericanCentral American IndianCherokeeCheyenneChickasawChileanChineseChippewaChoctawColombianColvilleComancheCosta RicanCreeCreekCroatianCrowCubanCypriotCzechCzechoslovakianDanishDelawareDominicanDutchDutch West IndianEastern EuropeanEcuadorianEgyptianEnglishEstonianEthiopianEuropeanFijianFilipinoFinnishFrenchFrench American IndianFrench CanadianGermanGerman RussianGhanaianGreekGuamanian/ChamorroGuatemalanGuyaneseHaitianHmongHonduranHopiHoumaHungarianIcelanderIndian (Asian)IndonesianInupiatIranianIraqiIrishIroquoisIsraeliItalianJamaicanJapaneseJordanianKenyanKiowaKoreanLaotianLatvianLebaneseLiberianLithuanianLumbeeLuxembourgerMacedonianMalaysianMalteseMarshalleseMenomineeMexicanMexican American IndianMongolianMoroccanNative HawaiianNavajoNepaleseNew ZealanderNicaraguanNigerianNorthern EuropeanNorwegianOkinawanOsageOttawaPaiutePakistaniPalestinianPanamanianParaguayanPennsylvania GermanPeruvianPimaPolishPortuguesePotawatomiPuebloPuerto RicanPuget Sound SalishRomanianRussianSalvadoranSamoanScandinavianScotch-IrishScottishSeminoleSenegaleseSerbianShoshoneSierra LeoneanSiouxSlavicSlovakSloveneSomaliSouth AfricanSouth AmericanSouth American IndianSoviet UnionSpaniardSpanishSpanish AmericanSpanish American IndianSri LankanSubsaharan AfricanSudaneseSwedishSwissSyrianTaiwaneseThaiTlingit-HaidaTohono O'OdhamTonganTrinidadian and TobagonianTsimshianTurkishU.S. Virgin IslanderUgandanUkrainianUruguayanUteVenezuelanVietnameseWelshWest IndianYakamaYaquiYumanYup'ikZimbabwean
Immigration
NonimmigrantsImmigrantsAfghanistanAfricaAlbaniaArgentinaArmeniaAsiaAustraliaAustriaBahamasBangladeshBarbadosBelarusBelgiumBelizeBoliviaBosnia and HerzegovinaBrazilBulgariaBurma/MyanmarCabo VerdeCambodiaCameroonCanadaCaribbeanCentral AmericaChileChinaColombiaCongoCosta RicaCroatiaCubaCzechoslovakiaDenmarkDominicaDominican RepublicEastern AfricaEastern AsiaEastern EuropeEcuadorEgyptEl SalvadorEnglandEritreaEthiopiaEuropeFijiFranceGermanyGhanaGreeceGrenadaGuatemalaGuyanaHaitiHondurasHong KongHungaryIndiaIndonesiaIranIraqIrelandIsraelItalyJamaicaJapanJordanKazakhstanKenyaKoreaKuwaitLaosLatin AmericaLatviaLebanonLiberiaLithuaniaMalaysiaMexicoMicronesiaMiddle AfricaMoldovaMoroccoNepalNetherlandsNicaraguaNigeriaNorth AmericaNorth MacedoniaNorthern AfricaNorthern EuropeNorwayOceaniaPakistanPanamaPeruPhilippinesPolandPortugalRomaniaRussiaSaudi ArabiaScotlandSenegalSerbiaSierra LeoneSingaporeSomaliaSouth AfricaSouth AmericaSouth Central AsiaSouth Eastern AsiaSouthern EuropeSpainSri LankaSt. Vincent and the GrenadinesSudanSwedenSwitzerlandSyriaTaiwanThailandTrinidad and TobagoTurkeyUgandaUkraineUruguayUzbekistanVenezuelaVietnamWest IndiesWestern AfricaWestern AsiaWestern EuropeYemenZaireZimbabweAzores
Vision Disability
Income
Poverty
Unemployment
Labor Participation
Family Structure
Vehicle Availability
Education Level
Disability

Vision Disability Comparison

Yugoslavians

Immigrants from China

Average
Exceptional
2.2%
VISION DISABILITY
46.5/ 100
METRIC RATING
176th/ 347
METRIC RANK
1.8%
VISION DISABILITY
100.0/ 100
METRIC RATING
14th/ 347
METRIC RANK

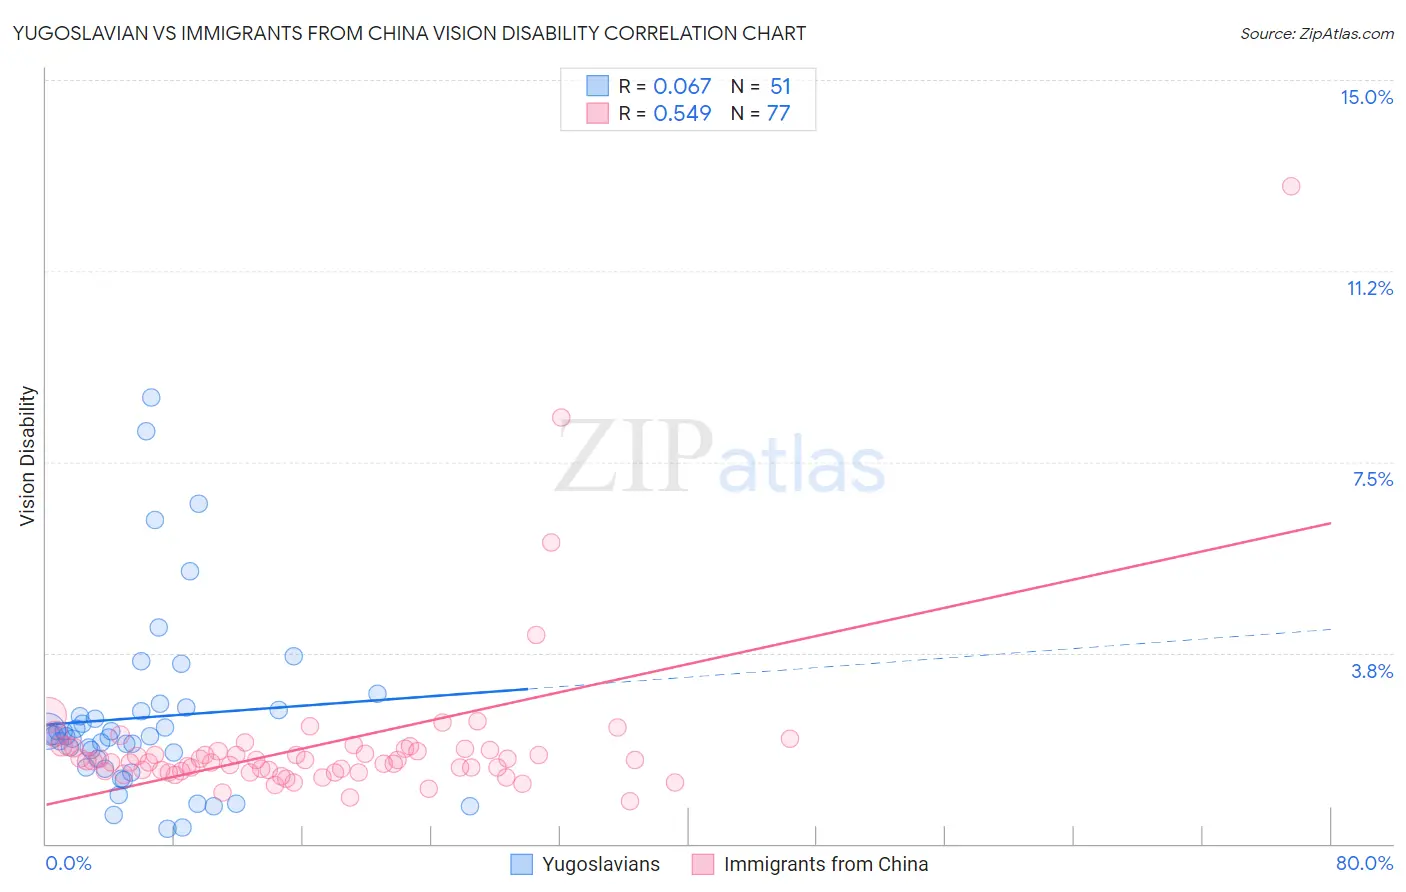
Yugoslavian vs Immigrants from China Vision Disability Correlation Chart

The statistical analysis conducted on geographies consisting of 285,572,549 people shows a slight positive correlation between the proportion of Yugoslavians and percentage of population with vision disability in the United States with a correlation coefficient (R) of 0.067 and weighted average of 2.2%. Similarly, the statistical analysis conducted on geographies consisting of 456,538,293 people shows a substantial positive correlation between the proportion of Immigrants from China and percentage of population with vision disability in the United States with a correlation coefficient (R) of 0.549 and weighted average of 1.8%, a difference of 18.4%.
Yugoslavian vs Immigrants from China Vision Disability

Vision Disability Correlation Summary

MeasurementYugoslavianImmigrants from China
Minimum0.30%0.84%
Maximum8.8%12.9%
Range8.5%12.1%
Mean2.5%1.9%
Median2.1%1.6%
Interquartile 25% (IQ1)1.5%1.4%
Interquartile 75% (IQ3)2.6%1.9%
Interquartile Range (IQR)1.1%0.43%
Standard Deviation (Sample)1.8%1.6%
Standard Deviation (Population)1.8%1.6%

Similar Demographics by Vision Disability

Demographics Similar to Yugoslavians by Vision Disability

In terms of vision disability, the demographic groups most similar to Yugoslavians are Slavic (2.2%, a difference of 0.040%), Immigrants from Fiji (2.2%, a difference of 0.070%), Immigrants from Oceania (2.2%, a difference of 0.090%), Immigrants from North America (2.2%, a difference of 0.13%), and Northern European (2.2%, a difference of 0.22%).
DemographicsRating | RankVision Disability
South American Indians
57.4
/100
|
#169
Average
2.2%
Swiss
55.7
/100
|
#170
Average
2.2%
Lebanese
54.3
/100
|
#171
Average
2.2%
Northern Europeans
50.1
/100
|
#172
Average
2.2%
Scandinavians
50.0
/100
|
#173
Average
2.2%
Immigrants | Canada
50.0
/100
|
#174
Average
2.2%
Immigrants | Fiji
47.6
/100
|
#175
Average
2.2%
Yugoslavians
46.5
/100
|
#176
Average
2.2%
Slavs
46.0
/100
|
#177
Average
2.2%
Immigrants | Oceania
45.1
/100
|
#178
Average
2.2%
Immigrants | North America
44.5
/100
|
#179
Average
2.2%
Uruguayans
42.7
/100
|
#180
Average
2.2%
Immigrants | Western Europe
41.1
/100
|
#181
Average
2.2%
Costa Ricans
40.7
/100
|
#182
Average
2.2%
Immigrants | Burma/Myanmar
37.9
/100
|
#183
Fair
2.2%

Demographics Similar to Immigrants from China by Vision Disability

In terms of vision disability, the demographic groups most similar to Immigrants from China are Immigrants from Eastern Asia (1.8%, a difference of 0.15%), Immigrants from Korea (1.8%, a difference of 0.22%), Immigrants from Bolivia (1.8%, a difference of 0.42%), Immigrants from Israel (1.8%, a difference of 0.45%), and Indian (Asian) (1.8%, a difference of 0.87%).
DemographicsRating | RankVision Disability
Immigrants | South Central Asia
100.0
/100
|
#7
Exceptional
1.8%
Iranians
100.0
/100
|
#8
Exceptional
1.8%
Immigrants | Singapore
100.0
/100
|
#9
Exceptional
1.8%
Immigrants | Hong Kong
100.0
/100
|
#10
Exceptional
1.8%
Immigrants | Israel
100.0
/100
|
#11
Exceptional
1.8%
Immigrants | Korea
100.0
/100
|
#12
Exceptional
1.8%
Immigrants | Eastern Asia
100.0
/100
|
#13
Exceptional
1.8%
Immigrants | China
100.0
/100
|
#14
Exceptional
1.8%
Immigrants | Bolivia
100.0
/100
|
#15
Exceptional
1.8%
Indians (Asian)
100.0
/100
|
#16
Exceptional
1.8%
Burmese
100.0
/100
|
#17
Exceptional
1.8%
Bolivians
100.0
/100
|
#18
Exceptional
1.9%
Immigrants | Sri Lanka
100.0
/100
|
#19
Exceptional
1.9%
Asians
100.0
/100
|
#20
Exceptional
1.9%
Turks
100.0
/100
|
#21
Exceptional
1.9%