Yugoslavian vs Arapaho Vision Disability
COMPARE
Yugoslavian
Arapaho
Vision Disability
Vision Disability Comparison
Yugoslavians
Arapaho
2.2%
VISION DISABILITY
46.5/ 100
METRIC RATING
176th/ 347
METRIC RANK
2.6%
VISION DISABILITY
0.0/ 100
METRIC RATING
308th/ 347
METRIC RANK
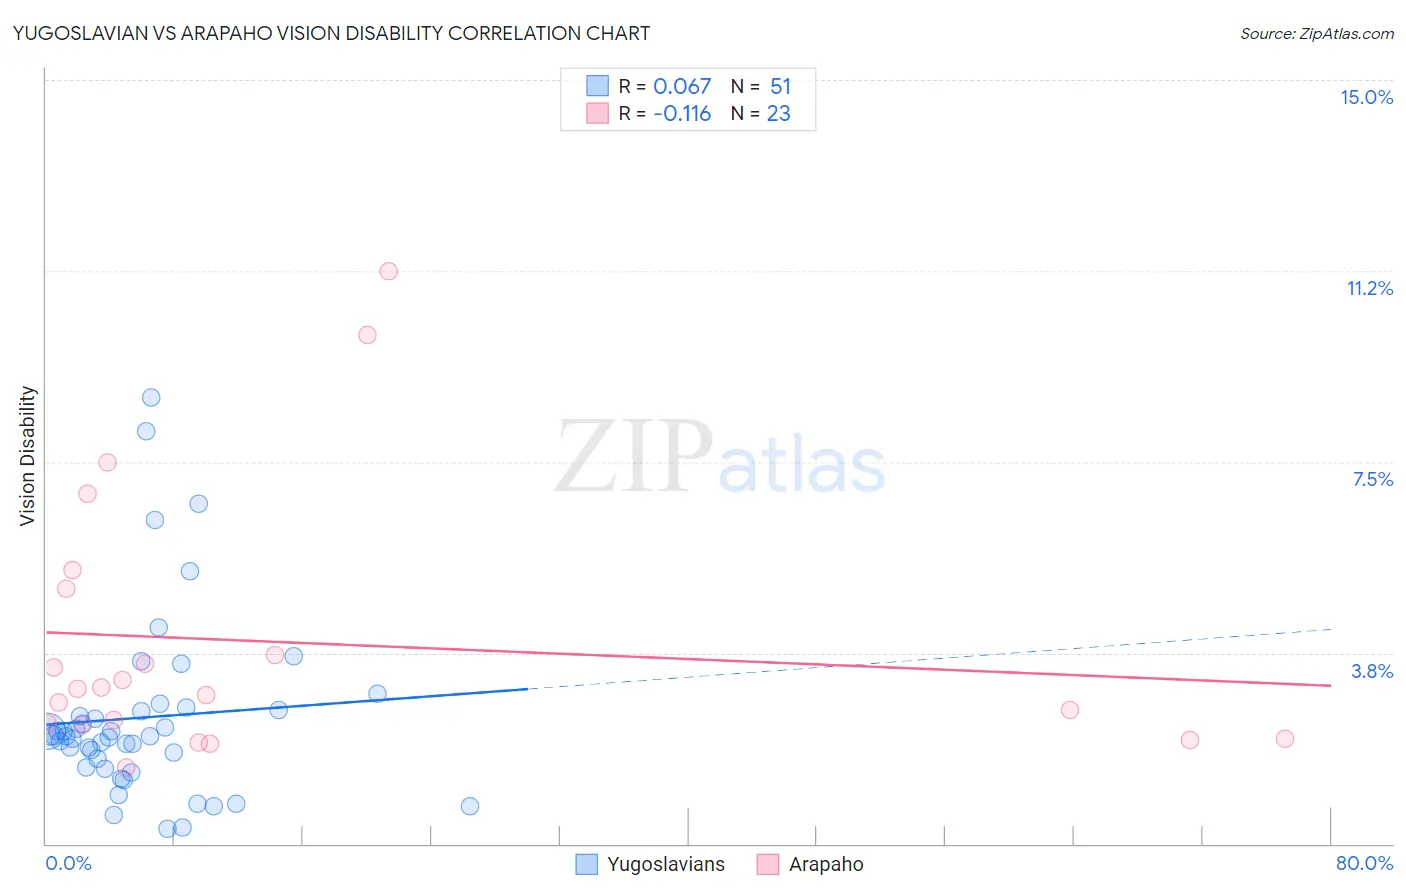
Yugoslavian vs Arapaho Vision Disability Correlation Chart
The statistical analysis conducted on geographies consisting of 285,572,549 people shows a slight positive correlation between the proportion of Yugoslavians and percentage of population with vision disability in the United States with a correlation coefficient (R) of 0.067 and weighted average of 2.2%. Similarly, the statistical analysis conducted on geographies consisting of 29,770,133 people shows a poor negative correlation between the proportion of Arapaho and percentage of population with vision disability in the United States with a correlation coefficient (R) of -0.116 and weighted average of 2.6%, a difference of 20.2%.
Vision Disability Correlation Summary
| Measurement | Yugoslavian | Arapaho |
| Minimum | 0.30% | 1.5% |
| Maximum | 8.8% | 11.2% |
| Range | 8.5% | 9.7% |
| Mean | 2.5% | 4.0% |
| Median | 2.1% | 3.1% |
| Interquartile 25% (IQ1) | 1.5% | 2.3% |
| Interquartile 75% (IQ3) | 2.6% | 5.0% |
| Interquartile Range (IQR) | 1.1% | 2.7% |
| Standard Deviation (Sample) | 1.8% | 2.6% |
| Standard Deviation (Population) | 1.8% | 2.5% |
Similar Demographics by Vision Disability
Demographics Similar to Yugoslavians by Vision Disability
In terms of vision disability, the demographic groups most similar to Yugoslavians are Slavic (2.2%, a difference of 0.040%), Immigrants from Fiji (2.2%, a difference of 0.070%), Immigrants from Oceania (2.2%, a difference of 0.090%), Immigrants from North America (2.2%, a difference of 0.13%), and Northern European (2.2%, a difference of 0.22%).
| Demographics | Rating | Rank | Vision Disability |
| South American Indians | 57.4 /100 | #169 | Average 2.2% |
| Swiss | 55.7 /100 | #170 | Average 2.2% |
| Lebanese | 54.3 /100 | #171 | Average 2.2% |
| Northern Europeans | 50.1 /100 | #172 | Average 2.2% |
| Scandinavians | 50.0 /100 | #173 | Average 2.2% |
| Immigrants | Canada | 50.0 /100 | #174 | Average 2.2% |
| Immigrants | Fiji | 47.6 /100 | #175 | Average 2.2% |
| Yugoslavians | 46.5 /100 | #176 | Average 2.2% |
| Slavs | 46.0 /100 | #177 | Average 2.2% |
| Immigrants | Oceania | 45.1 /100 | #178 | Average 2.2% |
| Immigrants | North America | 44.5 /100 | #179 | Average 2.2% |
| Uruguayans | 42.7 /100 | #180 | Average 2.2% |
| Immigrants | Western Europe | 41.1 /100 | #181 | Average 2.2% |
| Costa Ricans | 40.7 /100 | #182 | Average 2.2% |
| Immigrants | Burma/Myanmar | 37.9 /100 | #183 | Fair 2.2% |
Demographics Similar to Arapaho by Vision Disability
In terms of vision disability, the demographic groups most similar to Arapaho are Immigrants from Dominican Republic (2.6%, a difference of 0.020%), Iroquois (2.6%, a difference of 0.040%), Immigrants from Yemen (2.6%, a difference of 0.29%), Blackfeet (2.6%, a difference of 0.61%), and Hispanic or Latino (2.6%, a difference of 0.65%).
| Demographics | Rating | Rank | Vision Disability |
| Menominee | 0.0 /100 | #301 | Tragic 2.5% |
| Spanish American Indians | 0.0 /100 | #302 | Tragic 2.6% |
| Immigrants | Cabo Verde | 0.0 /100 | #303 | Tragic 2.6% |
| Aleuts | 0.0 /100 | #304 | Tragic 2.6% |
| Hispanics or Latinos | 0.0 /100 | #305 | Tragic 2.6% |
| Iroquois | 0.0 /100 | #306 | Tragic 2.6% |
| Immigrants | Dominican Republic | 0.0 /100 | #307 | Tragic 2.6% |
| Arapaho | 0.0 /100 | #308 | Tragic 2.6% |
| Immigrants | Yemen | 0.0 /100 | #309 | Tragic 2.6% |
| Blackfeet | 0.0 /100 | #310 | Tragic 2.6% |
| Dominicans | 0.0 /100 | #311 | Tragic 2.6% |
| Americans | 0.0 /100 | #312 | Tragic 2.6% |
| Potawatomi | 0.0 /100 | #313 | Tragic 2.6% |
| Inupiat | 0.0 /100 | #314 | Tragic 2.7% |
| Osage | 0.0 /100 | #315 | Tragic 2.7% |