Yugoslavian vs Immigrants from Fiji Hearing Disability
COMPARE
Yugoslavian
Immigrants from Fiji
Hearing Disability
Hearing Disability Comparison
Yugoslavians
Immigrants from Fiji
3.3%
HEARING DISABILITY
1.0/ 100
METRIC RATING
242nd/ 347
METRIC RANK
2.9%
HEARING DISABILITY
67.1/ 100
METRIC RATING
160th/ 347
METRIC RANK
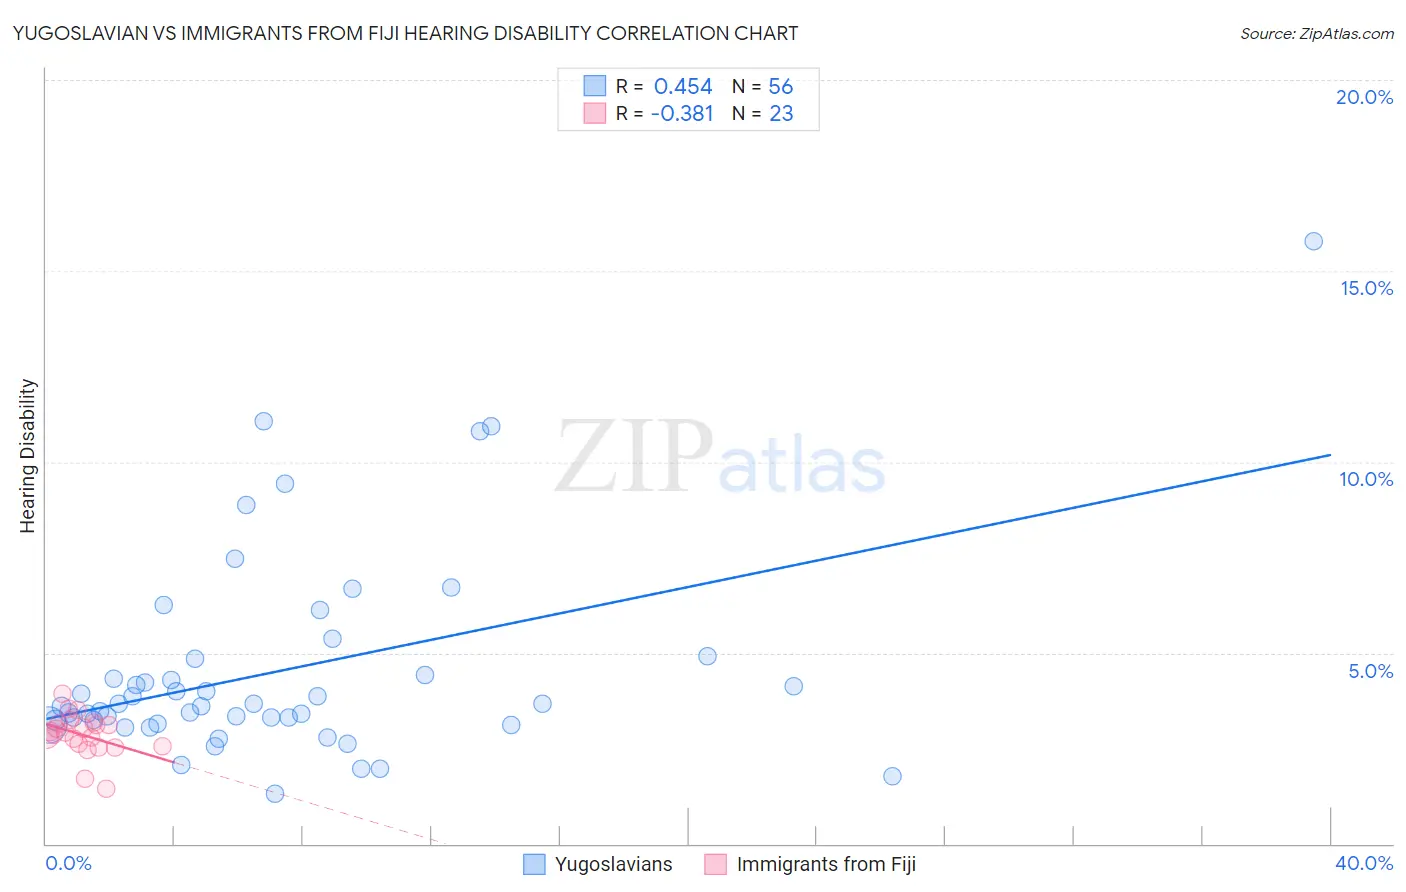
Yugoslavian vs Immigrants from Fiji Hearing Disability Correlation Chart
The statistical analysis conducted on geographies consisting of 285,663,811 people shows a moderate positive correlation between the proportion of Yugoslavians and percentage of population with hearing disability in the United States with a correlation coefficient (R) of 0.454 and weighted average of 3.3%. Similarly, the statistical analysis conducted on geographies consisting of 93,738,910 people shows a mild negative correlation between the proportion of Immigrants from Fiji and percentage of population with hearing disability in the United States with a correlation coefficient (R) of -0.381 and weighted average of 2.9%, a difference of 12.6%.
Hearing Disability Correlation Summary
| Measurement | Yugoslavian | Immigrants from Fiji |
| Minimum | 1.3% | 1.4% |
| Maximum | 15.8% | 3.9% |
| Range | 14.5% | 2.5% |
| Mean | 4.5% | 2.9% |
| Median | 3.6% | 2.9% |
| Interquartile 25% (IQ1) | 3.2% | 2.5% |
| Interquartile 75% (IQ3) | 4.6% | 3.2% |
| Interquartile Range (IQR) | 1.5% | 0.61% |
| Standard Deviation (Sample) | 2.7% | 0.54% |
| Standard Deviation (Population) | 2.7% | 0.53% |
Similar Demographics by Hearing Disability
Demographics Similar to Yugoslavians by Hearing Disability
In terms of hearing disability, the demographic groups most similar to Yugoslavians are Samoan (3.3%, a difference of 0.11%), Immigrants from Western Europe (3.3%, a difference of 0.17%), Immigrants from Netherlands (3.3%, a difference of 0.18%), Assyrian/Chaldean/Syriac (3.3%, a difference of 0.24%), and Nepalese (3.3%, a difference of 0.36%).
| Demographics | Rating | Rank | Hearing Disability |
| Guamanians/Chamorros | 2.2 /100 | #235 | Tragic 3.3% |
| Serbians | 2.2 /100 | #236 | Tragic 3.3% |
| Immigrants | Austria | 1.8 /100 | #237 | Tragic 3.3% |
| German Russians | 1.8 /100 | #238 | Tragic 3.3% |
| Nepalese | 1.2 /100 | #239 | Tragic 3.3% |
| Immigrants | Netherlands | 1.1 /100 | #240 | Tragic 3.3% |
| Samoans | 1.1 /100 | #241 | Tragic 3.3% |
| Yugoslavians | 1.0 /100 | #242 | Tragic 3.3% |
| Immigrants | Western Europe | 1.0 /100 | #243 | Tragic 3.3% |
| Assyrians/Chaldeans/Syriacs | 0.9 /100 | #244 | Tragic 3.3% |
| Immigrants | Scotland | 0.8 /100 | #245 | Tragic 3.3% |
| Immigrants | England | 0.7 /100 | #246 | Tragic 3.3% |
| Lithuanians | 0.6 /100 | #247 | Tragic 3.4% |
| Austrians | 0.6 /100 | #248 | Tragic 3.4% |
| Italians | 0.4 /100 | #249 | Tragic 3.4% |
Demographics Similar to Immigrants from Fiji by Hearing Disability
In terms of hearing disability, the demographic groups most similar to Immigrants from Fiji are Immigrants from Australia (2.9%, a difference of 0.020%), Albanian (2.9%, a difference of 0.060%), Immigrants from Japan (2.9%, a difference of 0.090%), Immigrants from Central America (3.0%, a difference of 0.24%), and Immigrants from Cambodia (3.0%, a difference of 0.25%).
| Demographics | Rating | Rank | Hearing Disability |
| Sudanese | 72.1 /100 | #153 | Good 2.9% |
| Immigrants | Lebanon | 71.5 /100 | #154 | Good 2.9% |
| Costa Ricans | 71.4 /100 | #155 | Good 2.9% |
| Immigrants | Poland | 70.2 /100 | #156 | Good 2.9% |
| Immigrants | Kazakhstan | 69.6 /100 | #157 | Good 2.9% |
| Immigrants | Burma/Myanmar | 69.5 /100 | #158 | Good 2.9% |
| Immigrants | Australia | 67.4 /100 | #159 | Good 2.9% |
| Immigrants | Fiji | 67.1 /100 | #160 | Good 2.9% |
| Albanians | 66.6 /100 | #161 | Good 2.9% |
| Immigrants | Japan | 66.3 /100 | #162 | Good 2.9% |
| Immigrants | Central America | 64.9 /100 | #163 | Good 3.0% |
| Immigrants | Cambodia | 64.8 /100 | #164 | Good 3.0% |
| Immigrants | Zimbabwe | 64.2 /100 | #165 | Good 3.0% |
| Immigrants | South Eastern Asia | 62.9 /100 | #166 | Good 3.0% |
| Immigrants | Eastern Europe | 58.1 /100 | #167 | Average 3.0% |