Yugoslavian vs Immigrants from Switzerland Hearing Disability
COMPARE
Yugoslavian
Immigrants from Switzerland
Hearing Disability
Hearing Disability Comparison
Yugoslavians
Immigrants from Switzerland
3.3%
HEARING DISABILITY
1.0/ 100
METRIC RATING
242nd/ 347
METRIC RANK
3.1%
HEARING DISABILITY
28.8/ 100
METRIC RATING
191st/ 347
METRIC RANK
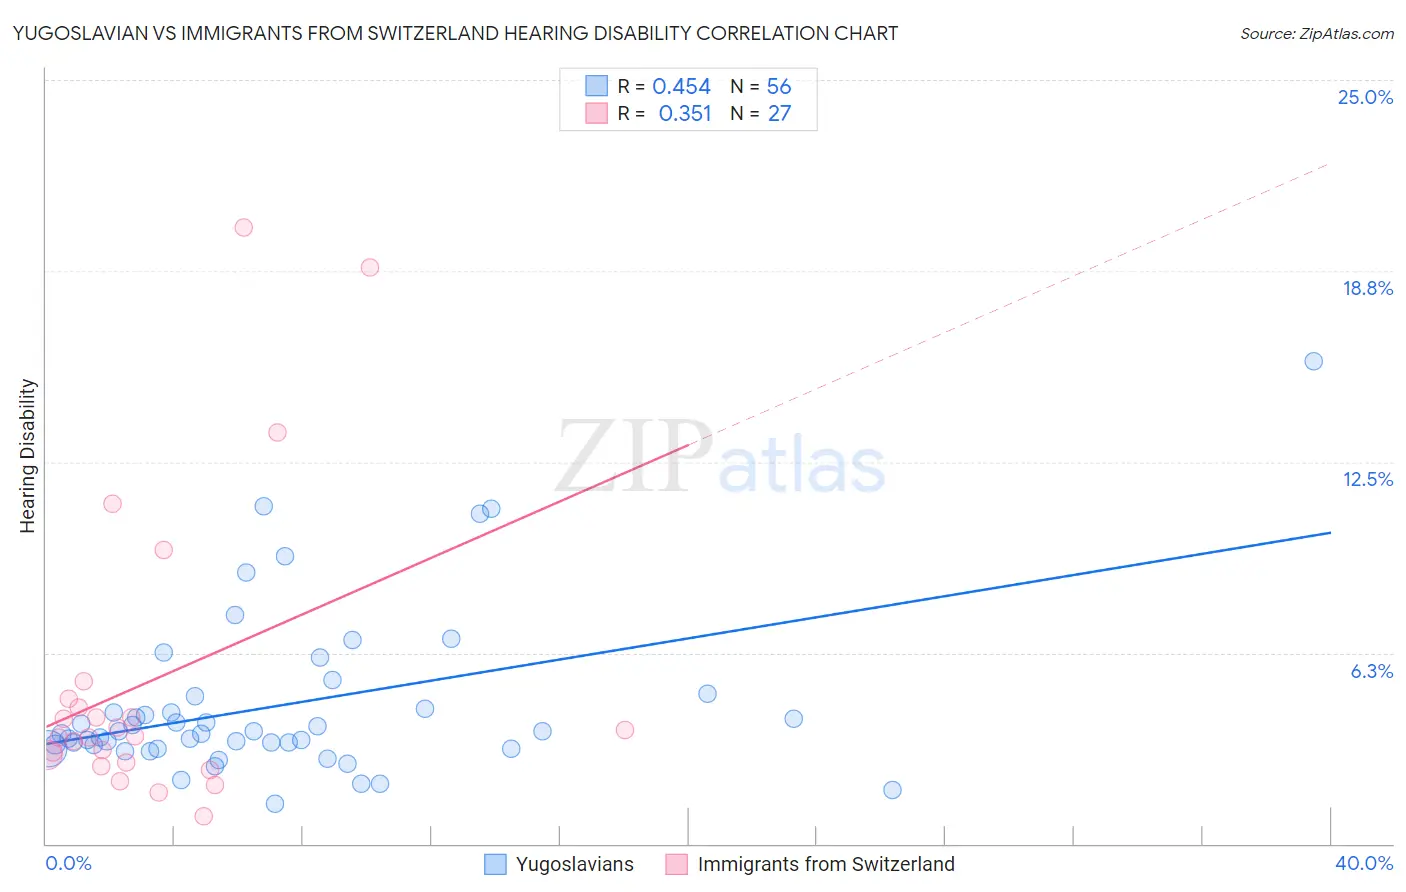
Yugoslavian vs Immigrants from Switzerland Hearing Disability Correlation Chart
The statistical analysis conducted on geographies consisting of 285,663,811 people shows a moderate positive correlation between the proportion of Yugoslavians and percentage of population with hearing disability in the United States with a correlation coefficient (R) of 0.454 and weighted average of 3.3%. Similarly, the statistical analysis conducted on geographies consisting of 148,077,684 people shows a mild positive correlation between the proportion of Immigrants from Switzerland and percentage of population with hearing disability in the United States with a correlation coefficient (R) of 0.351 and weighted average of 3.1%, a difference of 8.4%.
Hearing Disability Correlation Summary
| Measurement | Yugoslavian | Immigrants from Switzerland |
| Minimum | 1.3% | 0.89% |
| Maximum | 15.8% | 20.2% |
| Range | 14.5% | 19.3% |
| Mean | 4.5% | 5.4% |
| Median | 3.6% | 3.5% |
| Interquartile 25% (IQ1) | 3.2% | 2.7% |
| Interquartile 75% (IQ3) | 4.6% | 4.7% |
| Interquartile Range (IQR) | 1.5% | 2.1% |
| Standard Deviation (Sample) | 2.7% | 5.0% |
| Standard Deviation (Population) | 2.7% | 4.9% |
Similar Demographics by Hearing Disability
Demographics Similar to Yugoslavians by Hearing Disability
In terms of hearing disability, the demographic groups most similar to Yugoslavians are Samoan (3.3%, a difference of 0.11%), Immigrants from Western Europe (3.3%, a difference of 0.17%), Immigrants from Netherlands (3.3%, a difference of 0.18%), Assyrian/Chaldean/Syriac (3.3%, a difference of 0.24%), and Nepalese (3.3%, a difference of 0.36%).
| Demographics | Rating | Rank | Hearing Disability |
| Guamanians/Chamorros | 2.2 /100 | #235 | Tragic 3.3% |
| Serbians | 2.2 /100 | #236 | Tragic 3.3% |
| Immigrants | Austria | 1.8 /100 | #237 | Tragic 3.3% |
| German Russians | 1.8 /100 | #238 | Tragic 3.3% |
| Nepalese | 1.2 /100 | #239 | Tragic 3.3% |
| Immigrants | Netherlands | 1.1 /100 | #240 | Tragic 3.3% |
| Samoans | 1.1 /100 | #241 | Tragic 3.3% |
| Yugoslavians | 1.0 /100 | #242 | Tragic 3.3% |
| Immigrants | Western Europe | 1.0 /100 | #243 | Tragic 3.3% |
| Assyrians/Chaldeans/Syriacs | 0.9 /100 | #244 | Tragic 3.3% |
| Immigrants | Scotland | 0.8 /100 | #245 | Tragic 3.3% |
| Immigrants | England | 0.7 /100 | #246 | Tragic 3.3% |
| Lithuanians | 0.6 /100 | #247 | Tragic 3.4% |
| Austrians | 0.6 /100 | #248 | Tragic 3.4% |
| Italians | 0.4 /100 | #249 | Tragic 3.4% |
Demographics Similar to Immigrants from Switzerland by Hearing Disability
In terms of hearing disability, the demographic groups most similar to Immigrants from Switzerland are Korean (3.1%, a difference of 0.13%), Macedonian (3.1%, a difference of 0.21%), Immigrants from South Africa (3.1%, a difference of 0.25%), African (3.0%, a difference of 0.44%), and South African (3.1%, a difference of 0.51%).
| Demographics | Rating | Rank | Hearing Disability |
| Immigrants | Ireland | 37.4 /100 | #184 | Fair 3.0% |
| Immigrants | Southern Europe | 35.3 /100 | #185 | Fair 3.0% |
| Immigrants | Mexico | 34.9 /100 | #186 | Fair 3.0% |
| Blacks/African Americans | 34.7 /100 | #187 | Fair 3.0% |
| Mexican American Indians | 34.7 /100 | #188 | Fair 3.0% |
| Africans | 32.9 /100 | #189 | Fair 3.0% |
| Immigrants | South Africa | 31.1 /100 | #190 | Fair 3.1% |
| Immigrants | Switzerland | 28.8 /100 | #191 | Fair 3.1% |
| Koreans | 27.6 /100 | #192 | Fair 3.1% |
| Macedonians | 27.0 /100 | #193 | Fair 3.1% |
| South Africans | 24.5 /100 | #194 | Fair 3.1% |
| Spanish American Indians | 24.1 /100 | #195 | Fair 3.1% |
| Immigrants | Europe | 22.9 /100 | #196 | Fair 3.1% |
| Immigrants | Bosnia and Herzegovina | 20.6 /100 | #197 | Fair 3.1% |
| Immigrants | Croatia | 20.5 /100 | #198 | Fair 3.1% |