Yugoslavian vs Guyanese Hearing Disability
COMPARE
Yugoslavian
Guyanese
Hearing Disability
Hearing Disability Comparison
Yugoslavians
Guyanese
3.3%
HEARING DISABILITY
1.0/ 100
METRIC RATING
242nd/ 347
METRIC RANK
2.3%
HEARING DISABILITY
100.0/ 100
METRIC RATING
3rd/ 347
METRIC RANK
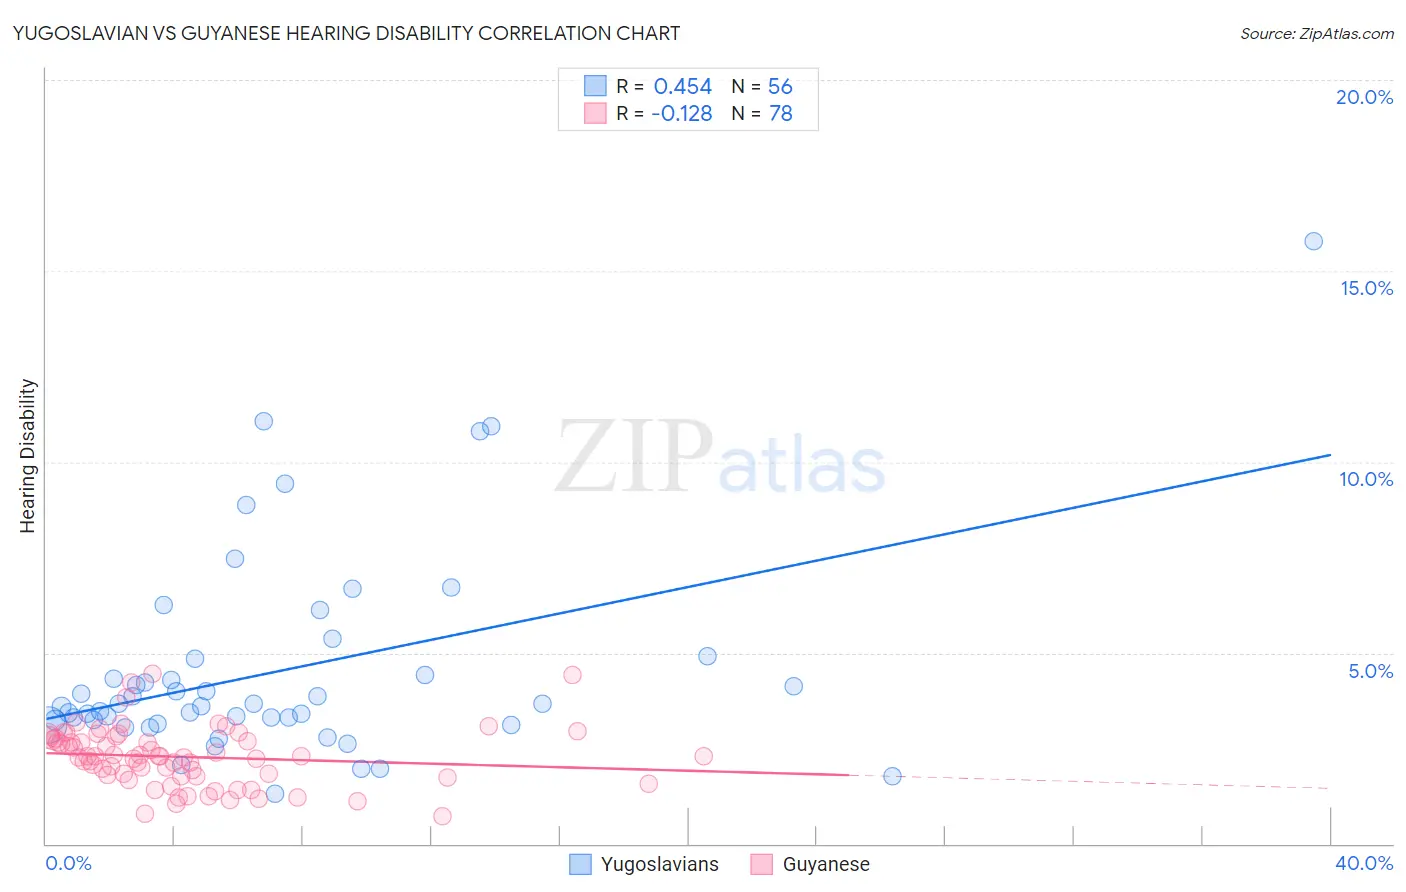
Yugoslavian vs Guyanese Hearing Disability Correlation Chart
The statistical analysis conducted on geographies consisting of 285,663,811 people shows a moderate positive correlation between the proportion of Yugoslavians and percentage of population with hearing disability in the United States with a correlation coefficient (R) of 0.454 and weighted average of 3.3%. Similarly, the statistical analysis conducted on geographies consisting of 176,815,788 people shows a poor negative correlation between the proportion of Guyanese and percentage of population with hearing disability in the United States with a correlation coefficient (R) of -0.128 and weighted average of 2.3%, a difference of 45.1%.
Hearing Disability Correlation Summary
| Measurement | Yugoslavian | Guyanese |
| Minimum | 1.3% | 0.72% |
| Maximum | 15.8% | 4.4% |
| Range | 14.5% | 3.7% |
| Mean | 4.5% | 2.3% |
| Median | 3.6% | 2.3% |
| Interquartile 25% (IQ1) | 3.2% | 1.8% |
| Interquartile 75% (IQ3) | 4.6% | 2.8% |
| Interquartile Range (IQR) | 1.5% | 0.99% |
| Standard Deviation (Sample) | 2.7% | 0.77% |
| Standard Deviation (Population) | 2.7% | 0.76% |
Similar Demographics by Hearing Disability
Demographics Similar to Yugoslavians by Hearing Disability
In terms of hearing disability, the demographic groups most similar to Yugoslavians are Samoan (3.3%, a difference of 0.11%), Immigrants from Western Europe (3.3%, a difference of 0.17%), Immigrants from Netherlands (3.3%, a difference of 0.18%), Assyrian/Chaldean/Syriac (3.3%, a difference of 0.24%), and Nepalese (3.3%, a difference of 0.36%).
| Demographics | Rating | Rank | Hearing Disability |
| Guamanians/Chamorros | 2.2 /100 | #235 | Tragic 3.3% |
| Serbians | 2.2 /100 | #236 | Tragic 3.3% |
| Immigrants | Austria | 1.8 /100 | #237 | Tragic 3.3% |
| German Russians | 1.8 /100 | #238 | Tragic 3.3% |
| Nepalese | 1.2 /100 | #239 | Tragic 3.3% |
| Immigrants | Netherlands | 1.1 /100 | #240 | Tragic 3.3% |
| Samoans | 1.1 /100 | #241 | Tragic 3.3% |
| Yugoslavians | 1.0 /100 | #242 | Tragic 3.3% |
| Immigrants | Western Europe | 1.0 /100 | #243 | Tragic 3.3% |
| Assyrians/Chaldeans/Syriacs | 0.9 /100 | #244 | Tragic 3.3% |
| Immigrants | Scotland | 0.8 /100 | #245 | Tragic 3.3% |
| Immigrants | England | 0.7 /100 | #246 | Tragic 3.3% |
| Lithuanians | 0.6 /100 | #247 | Tragic 3.4% |
| Austrians | 0.6 /100 | #248 | Tragic 3.4% |
| Italians | 0.4 /100 | #249 | Tragic 3.4% |
Demographics Similar to Guyanese by Hearing Disability
In terms of hearing disability, the demographic groups most similar to Guyanese are Immigrants from St. Vincent and the Grenadines (2.3%, a difference of 1.4%), Immigrants from Guyana (2.3%, a difference of 1.4%), Immigrants from Barbados (2.4%, a difference of 3.3%), Immigrants from Grenada (2.2%, a difference of 4.3%), and Vietnamese (2.4%, a difference of 4.5%).
| Demographics | Rating | Rank | Hearing Disability |
| Immigrants | Grenada | 100.0 /100 | #1 | Exceptional 2.2% |
| Immigrants | St. Vincent and the Grenadines | 100.0 /100 | #2 | Exceptional 2.3% |
| Guyanese | 100.0 /100 | #3 | Exceptional 2.3% |
| Immigrants | Guyana | 100.0 /100 | #4 | Exceptional 2.3% |
| Immigrants | Barbados | 100.0 /100 | #5 | Exceptional 2.4% |
| Vietnamese | 100.0 /100 | #6 | Exceptional 2.4% |
| Immigrants | Bangladesh | 100.0 /100 | #7 | Exceptional 2.4% |
| British West Indians | 100.0 /100 | #8 | Exceptional 2.4% |
| Immigrants | Dominican Republic | 100.0 /100 | #9 | Exceptional 2.4% |
| Immigrants | Ecuador | 99.9 /100 | #10 | Exceptional 2.5% |
| Immigrants | Trinidad and Tobago | 99.9 /100 | #11 | Exceptional 2.5% |
| Trinidadians and Tobagonians | 99.9 /100 | #12 | Exceptional 2.5% |
| Sierra Leoneans | 99.9 /100 | #13 | Exceptional 2.5% |
| Ecuadorians | 99.9 /100 | #14 | Exceptional 2.5% |
| Barbadians | 99.9 /100 | #15 | Exceptional 2.5% |