Yugoslavian vs Immigrants from Fiji Per Capita Income
COMPARE
Yugoslavian
Immigrants from Fiji
Per Capita Income
Per Capita Income Comparison
Yugoslavians
Immigrants from Fiji
$42,792
PER CAPITA INCOME
27.4/ 100
METRIC RATING
191st/ 347
METRIC RANK
$42,694
PER CAPITA INCOME
25.2/ 100
METRIC RATING
194th/ 347
METRIC RANK
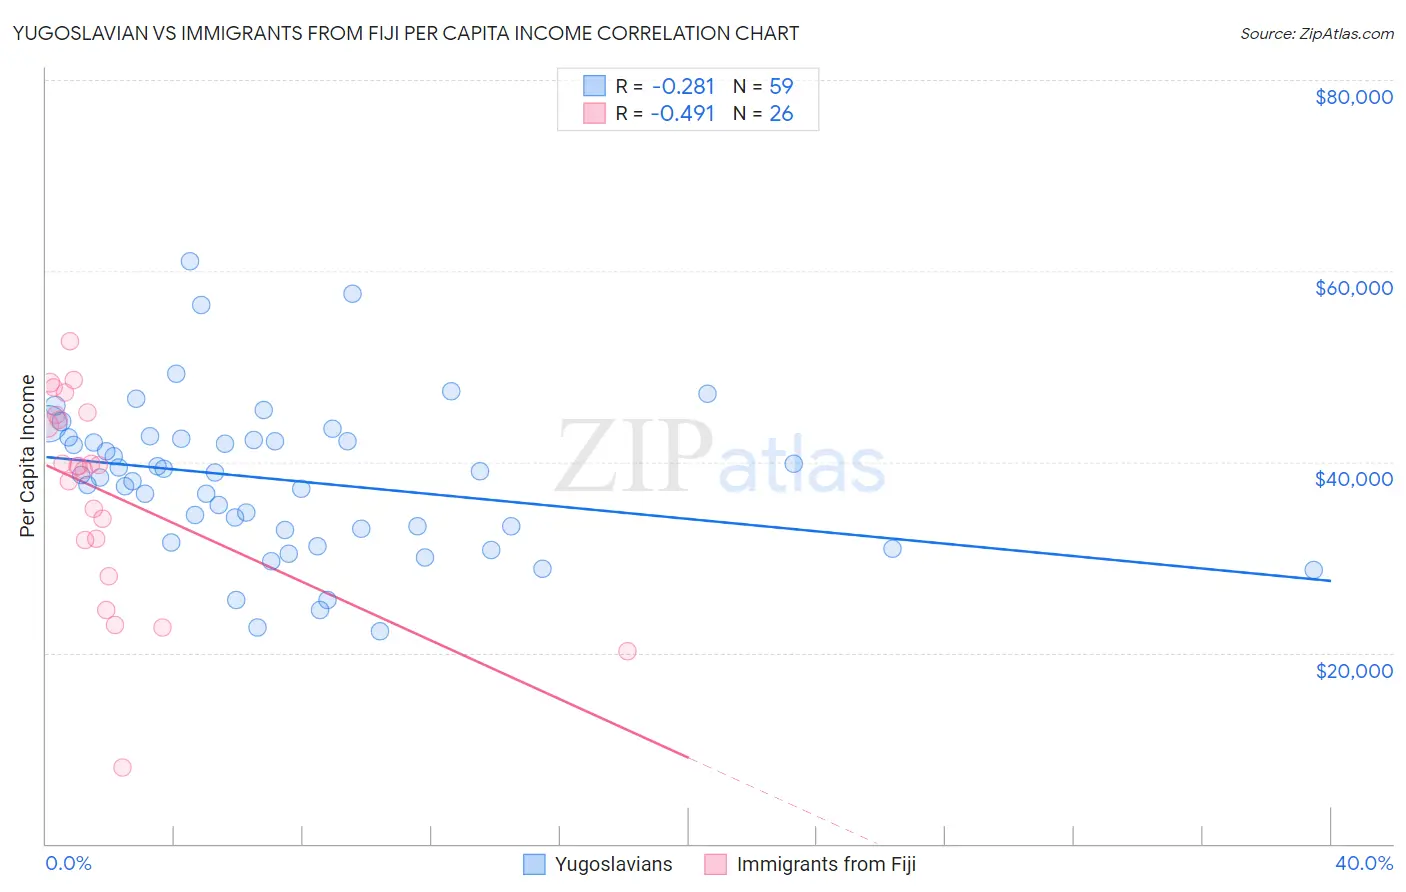
Yugoslavian vs Immigrants from Fiji Per Capita Income Correlation Chart
The statistical analysis conducted on geographies consisting of 285,729,855 people shows a weak negative correlation between the proportion of Yugoslavians and per capita income in the United States with a correlation coefficient (R) of -0.281 and weighted average of $42,792. Similarly, the statistical analysis conducted on geographies consisting of 93,756,204 people shows a moderate negative correlation between the proportion of Immigrants from Fiji and per capita income in the United States with a correlation coefficient (R) of -0.491 and weighted average of $42,694, a difference of 0.23%.
Per Capita Income Correlation Summary
| Measurement | Yugoslavian | Immigrants from Fiji |
| Minimum | $22,217 | $8,026 |
| Maximum | $61,060 | $52,700 |
| Range | $38,843 | $44,674 |
| Mean | $38,123 | $36,824 |
| Median | $38,605 | $39,532 |
| Interquartile 25% (IQ1) | $32,828 | $31,785 |
| Interquartile 75% (IQ3) | $42,402 | $44,942 |
| Interquartile Range (IQR) | $9,574 | $13,157 |
| Standard Deviation (Sample) | $8,004 | $10,646 |
| Standard Deviation (Population) | $7,935 | $10,440 |
Demographics Similar to Yugoslavians and Immigrants from Fiji by Per Capita Income
In terms of per capita income, the demographic groups most similar to Yugoslavians are Kenyan ($42,808, a difference of 0.040%), Iraqi ($42,760, a difference of 0.070%), Immigrants from Sierra Leone ($42,752, a difference of 0.090%), Bermudan ($42,911, a difference of 0.28%), and Immigrants from Kenya ($42,661, a difference of 0.31%). Similarly, the demographic groups most similar to Immigrants from Fiji are Immigrants from Kenya ($42,661, a difference of 0.080%), Immigrants from Sierra Leone ($42,752, a difference of 0.13%), Iraqi ($42,760, a difference of 0.16%), Dutch ($42,605, a difference of 0.21%), and Kenyan ($42,808, a difference of 0.27%).
| Demographics | Rating | Rank | Per Capita Income |
| Immigrants | Vietnam | 38.1 /100 | #182 | Fair $43,229 |
| Germans | 33.9 /100 | #183 | Fair $43,067 |
| Spaniards | 32.9 /100 | #184 | Fair $43,028 |
| Immigrants | Immigrants | 32.5 /100 | #185 | Fair $43,010 |
| French Canadians | 32.3 /100 | #186 | Fair $43,003 |
| Immigrants | Colombia | 31.5 /100 | #187 | Fair $42,971 |
| Immigrants | Africa | 31.0 /100 | #188 | Fair $42,950 |
| Bermudans | 30.1 /100 | #189 | Fair $42,911 |
| Kenyans | 27.7 /100 | #190 | Fair $42,808 |
| Yugoslavians | 27.4 /100 | #191 | Fair $42,792 |
| Iraqis | 26.7 /100 | #192 | Fair $42,760 |
| Immigrants | Sierra Leone | 26.5 /100 | #193 | Fair $42,752 |
| Immigrants | Fiji | 25.2 /100 | #194 | Fair $42,694 |
| Immigrants | Kenya | 24.5 /100 | #195 | Fair $42,661 |
| Dutch | 23.4 /100 | #196 | Fair $42,605 |
| Scotch-Irish | 22.6 /100 | #197 | Fair $42,563 |
| Immigrants | Portugal | 19.7 /100 | #198 | Poor $42,412 |
| Barbadians | 19.6 /100 | #199 | Poor $42,406 |
| Vietnamese | 19.0 /100 | #200 | Poor $42,368 |
| Immigrants | Thailand | 17.6 /100 | #201 | Poor $42,289 |
| Immigrants | Bosnia and Herzegovina | 17.5 /100 | #202 | Poor $42,278 |